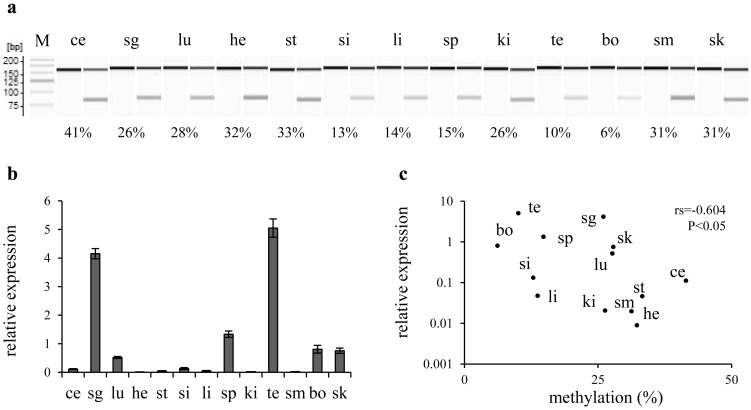
Fig. 2.
Correlation between DNA methylation and Runx2 expression among mouse organs. a) A gel image as output from the results of combined bisulfite restriction analysis (CoBRA) targeting CpG-2,505 in mouse organs. Fragments digested with HpyCH4IV were loaded onto odd lanes, except for the leftmost lane (showing a 25-bp DNA ladder; M). In the lanes immediately on the left, the fragment without the digestion is loaded as the experimental control. The PCR product 150 bp long is digested into fragments with the length of 73 and 77 bp when CpG-2,505 is methylated. Various rates of methylation are shown as indicating each score below their lanes. b) A bar chart shows the results of real-time RT-PCR. Columns and their error bars indicate mean and standard error, respectively, of relative expression levels of Runx2 mRNA in each organ to the sample mean. c) Each organ is plotted on the scatter diagram. Vertical and horizontal scales indicate relative expression levels of Runx2 mRNA and the methylation rate of CpG-2,505, respectively. A negative correlation was detected between Runx2 expression and CpG-2,505 methylation among mouse organs. ce: cerebellum, sg: salivary glands, lu: lungs, he: heart, st: stomach, si: small intestine, li: liver, sp: spleen, ki: kidneys, te: testes, bo: bone, sm: skeletal muscle and sk: skin.

