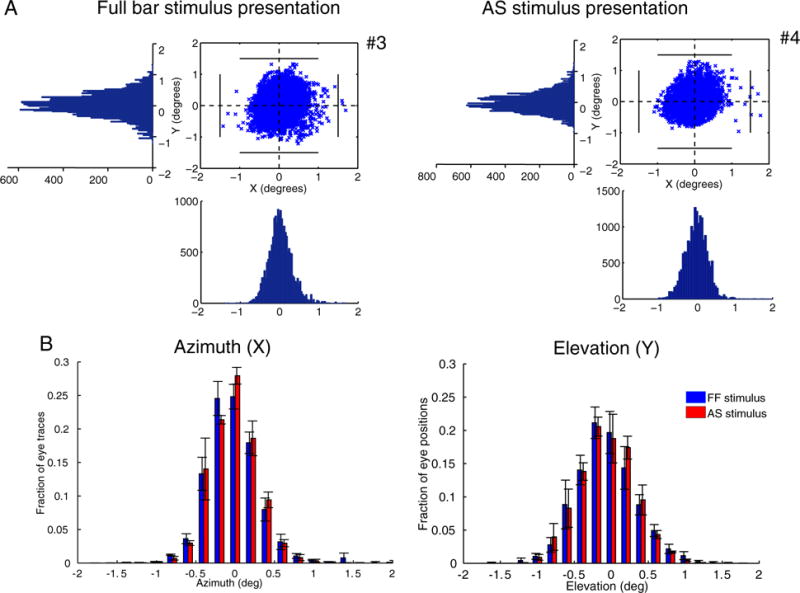
Fig. 5.

Eye positions for different stimulus presentations. (A) Eye movements of one control subject (S1) under the full field stimulus presentation (left) and under the AS stimulus presentation (right). Eye positions plotted at 60Hz for one whole session (6.4 min). The number of eye deviations, defined as excursions >1.5° from the fixation point is indicated next to the graphs with the number sign (#). The eye movements for all subjects are shown in Fig. S4. (B) Average fraction of eye traces with respect to the azimuth (left) and elevation (right) for the full field stimulus presentation (blue bars) and the AS stimulus presentation (red bars) for 3/5 control subjects. Two of the subjects (S4 and S5) were excluded as their eye movements under the full field stimulus presentation were not recorded. However, their eye movements were recorded under the AS assuring that the subjects were able to maintain fixation (Fig. S4B). The error bars indicate the standard error of the mean across subjects (N = 3). The distributions are not significantly different between conditions (p = 0.55 for the azimuth distributions and p = 0.77 for the elevation distributions) suggesting that the pRF changes seen in Fig. 4 are not the result of eye movements.
