Fig. 6.

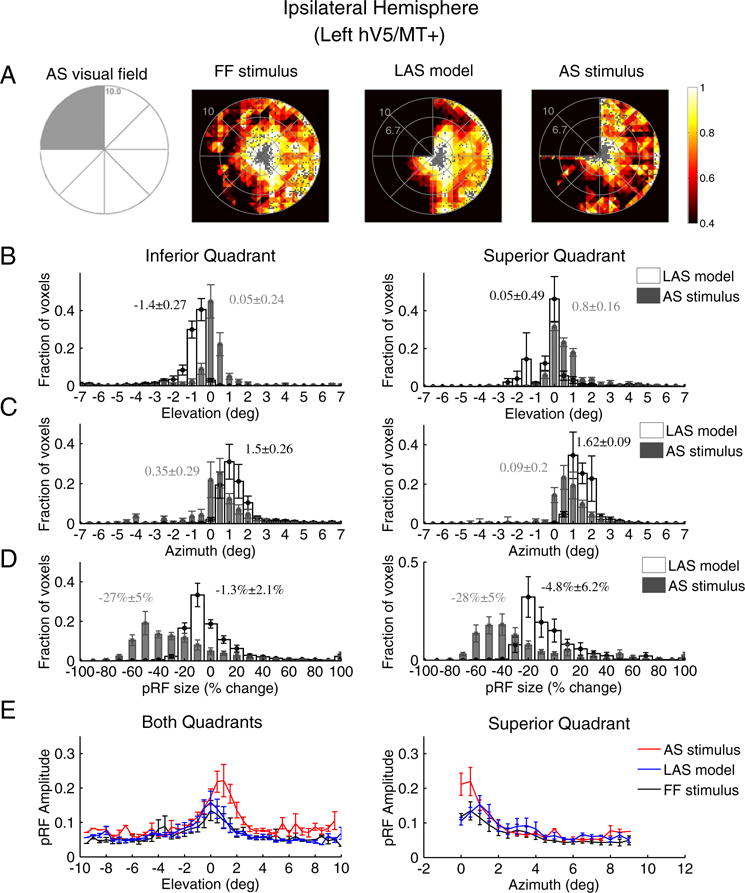
PRF location, size and amplitude changes in ipsilateral hV5/MT+ under the AS condition. (A) Visual field coverage maps of area hV5/MT+ ipsilateral to the AS (left hemisphere) for a subject under the full field (FF) stimulus condition (2nd column), under the LAS model (3rd column) and under the AS condition (4th column). On the left, a sketch of the visual field indicates the location of the AS (shaded gray area). The visual field coverage maps under full field stimulation or under the LAS model, span the contralateral hemifield. The visual field coverage under the AS condition on the other hand shows a relative displacement of the pRFs towards the superior quadrant, which is the quadrant opposite from the AS. (B) Average pRF center elevation distribution from voxels in ipsilateral hV5/MT+ of 5 subjects under the AS condition (gray bars) and under the LAS model (white bars). As in Fig. 4A, the voxels are divided into two groups according to their pRF center location as estimated from the full field stimulus condition, one for pRFs in the inferior quadrant (left panel) and the other for pRFs at the superior quadrant (right panel). The mean and standard error of the mean of each distribution is indicated on top of the graphs with gray color for the AS stimulus and black color for the LAS model. The pRF center elevation distribution does not change significantly in the presence of the AS for voxels in the superior quadrant (right). PRFs of the inferior quadrant, however, shift their location towards the superior quadrant in the case of the AS condition (gray bars, left) compared with the distribution of the LAS model. (C) Same as in b for the pRF center azimuth. The pRF center azimuth distributions significantly shift towards the vertical meridian under the AS condition for both the inferior and superior quadrants. (D) Average percent change of the pRF size (as described in Fig. 4B) for 5 subjects under the LAS model (white bars) and the AS stimulus condition (gray bars) separately plotted for voxels located in the inferior quadrant (left panel) and the superior quadrant (right panel). The pRF size of left (ipsilateral) hV5/MT+ under the AS condition is decreased more than expected based on the LAS model (white bars). (E) Left: average pRF amplitude of the pRF topographies in left hV5/MT+ of 5 subjects under the full stimulus condition (black), under the LAS-prediction condition (blue) and under the AS condition (red) as a function of pRF elevation. The pRF amplitude is larger under the AS condition for pRFs located in the superior quadrant (elevation >0). Right, average pRF amplitude of voxels in left hV5/MT+ with pRF center locations in the superior quadrant as a function of pRF azimuth. The pRF amplitude is larger within 1° from the vertical border of the AS (azimuth = 0) in the AS stimulus case (red) compared with the LAS-prediction (blue) and the full stimulus condition (black). For all graphs, the error bars indicate the standard error of the mean across subjects (N = 5).
