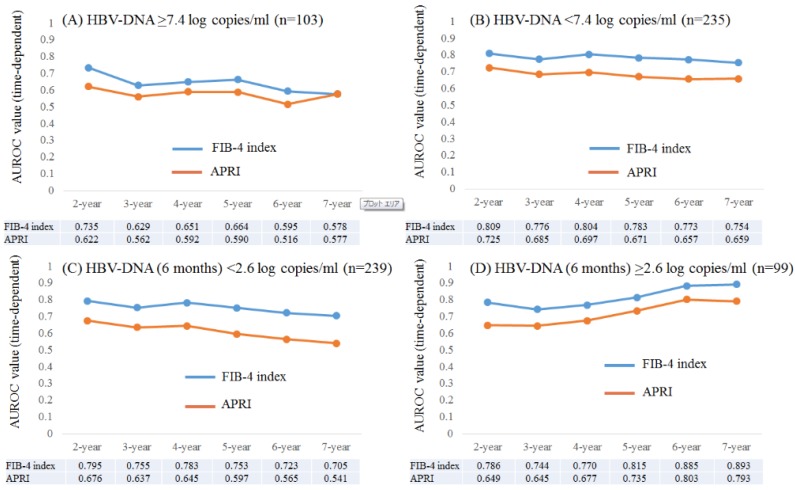
Figure 5.
Subgroup analyses. Plots of annual AUROCs of FIB-4 index and APRI for HCC incidence after ETV therapy for patients with HBV-DNA ≥7.4 log copies/ml at baseline (n=103) (A) and HBV-DNA <7.4 log copies/ml at baseline (n=235) (B). Plots of annual AUROCs of FIB-4 index and APRI for HCC incidence after ETV therapy for patients with HBV-DNA <2.6 log copies/ml at 6 months (n=239) (C) and HBV-DNA ≥2.6 log copies/ml at 6 months (n=99) (D).

