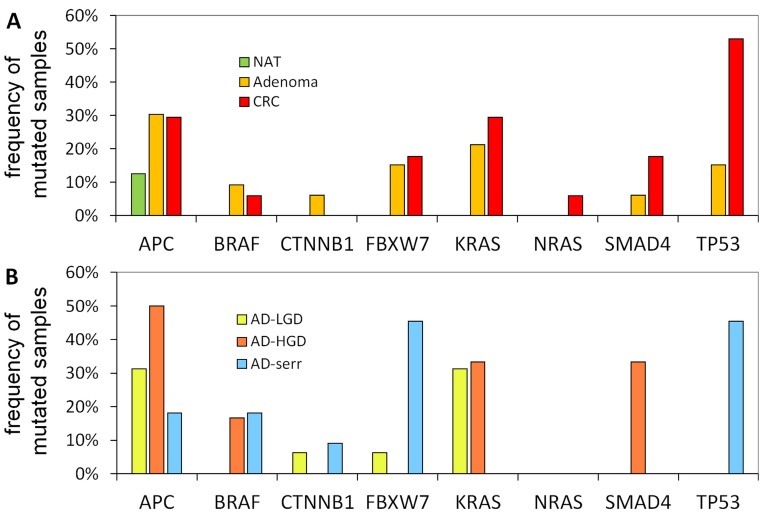
Figure 4.
Mutation frequencies in colorectal cancer and different stages of adenomas. The figure demonstrates the proportion of samples in different pathological groups bearing at least one mutation in a given gene. NAT: normal adjacent tumor samples; CRC: colorectal cancer samples; AD-LGD: low-grade adenoma samples; AD-HGD: high-grade adenoma samples; AD-serr: serrated adenoma samples.

