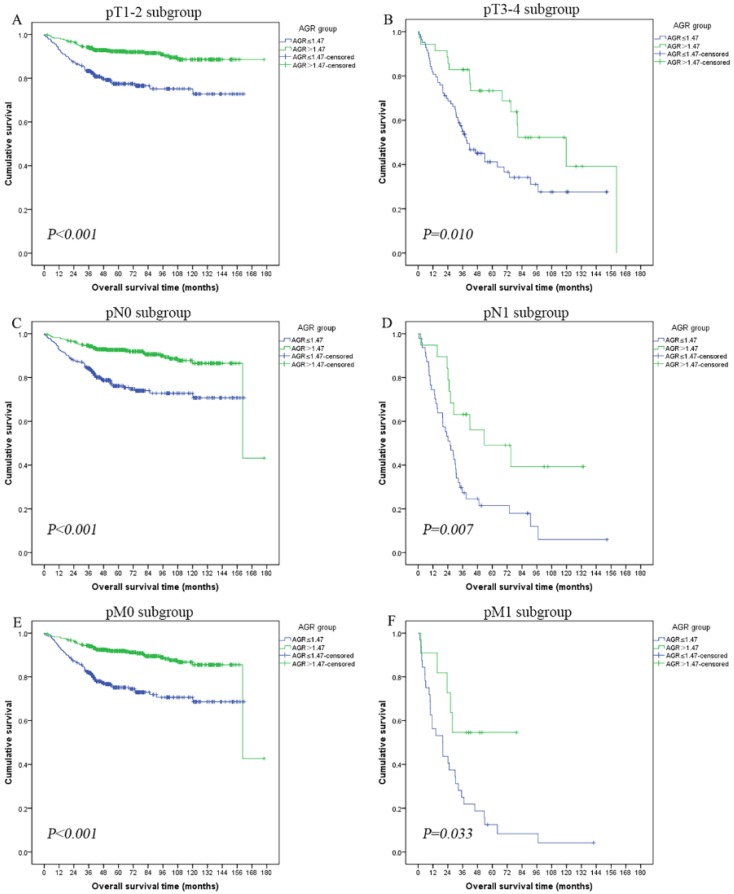
Figure 3.
Kaplan-Meier curves showing overall survival (OS) according to the preoperative optimal value of albumin to globulin ratio (AGR) in all patients with renal cell carcinoma. Patients were stratified according to the pT-status, pN-status, and pM-status. (A) Kaplan-Meier analysis of OS in pT1-2 subgroup. (B) Kaplan-Meier analysis of OS in pT3-4 subgroup. (C) Kaplan-Meier analysis of OS in pN0 subgroup. (D) Kaplan-Meier analysis of OS in pN1 subgroup. (E) Kaplan-Meier analysis of OS in pM0 subgroup. (F) Kaplan-Meier analysis of OS in pM1 subgroup.

