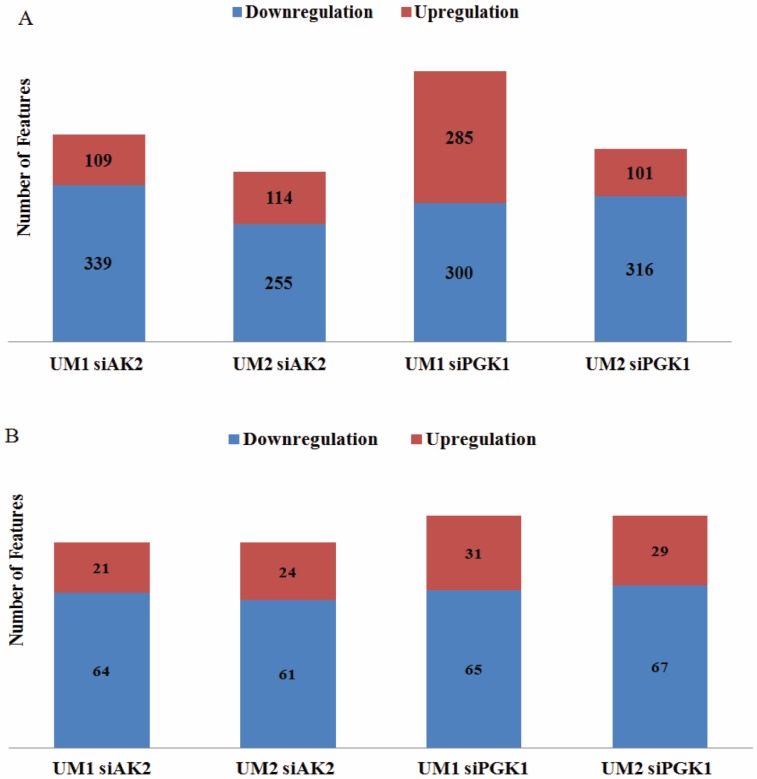
Figure 4.
The number of upregulated/downregulated metabolic features in UM1 or UM2 cells due to AK2 or PGK1 knockdown. (A) The number of upregulated/downregulated metabolic features that were significantly changed in UM1 or UM2 cells with either AK2 or PGK1 knockdown (B) The number of upregulated/downregulated metabolic features which were commonly changed between UM1 and UM2 cells with AK2 or PGK1 knockdown.

