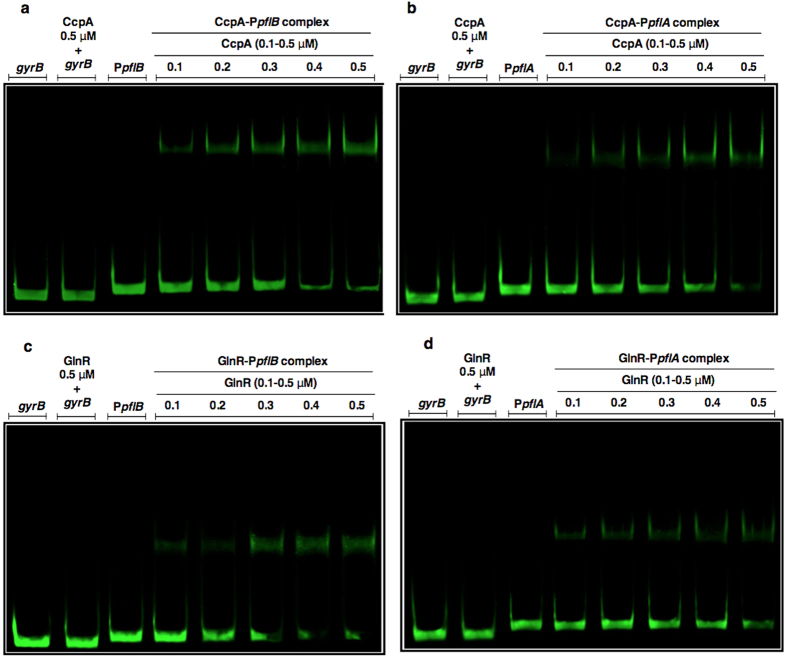
Figure 1.
EMSA analysis showing the direct interaction of CcpA (a and b), GlnR (c and d), with PpflB or PpflA, respectively. Each lane contains approximately 30 ng PpflB or PpflA. CcpA and GlnR were used between 0.1 to 0.5 μM. The coding sequence of gyrB (30 ng) was used as a negative control. Gels were stained with SYBR Green EMSA for visualizing DNA.

