Figure 3.

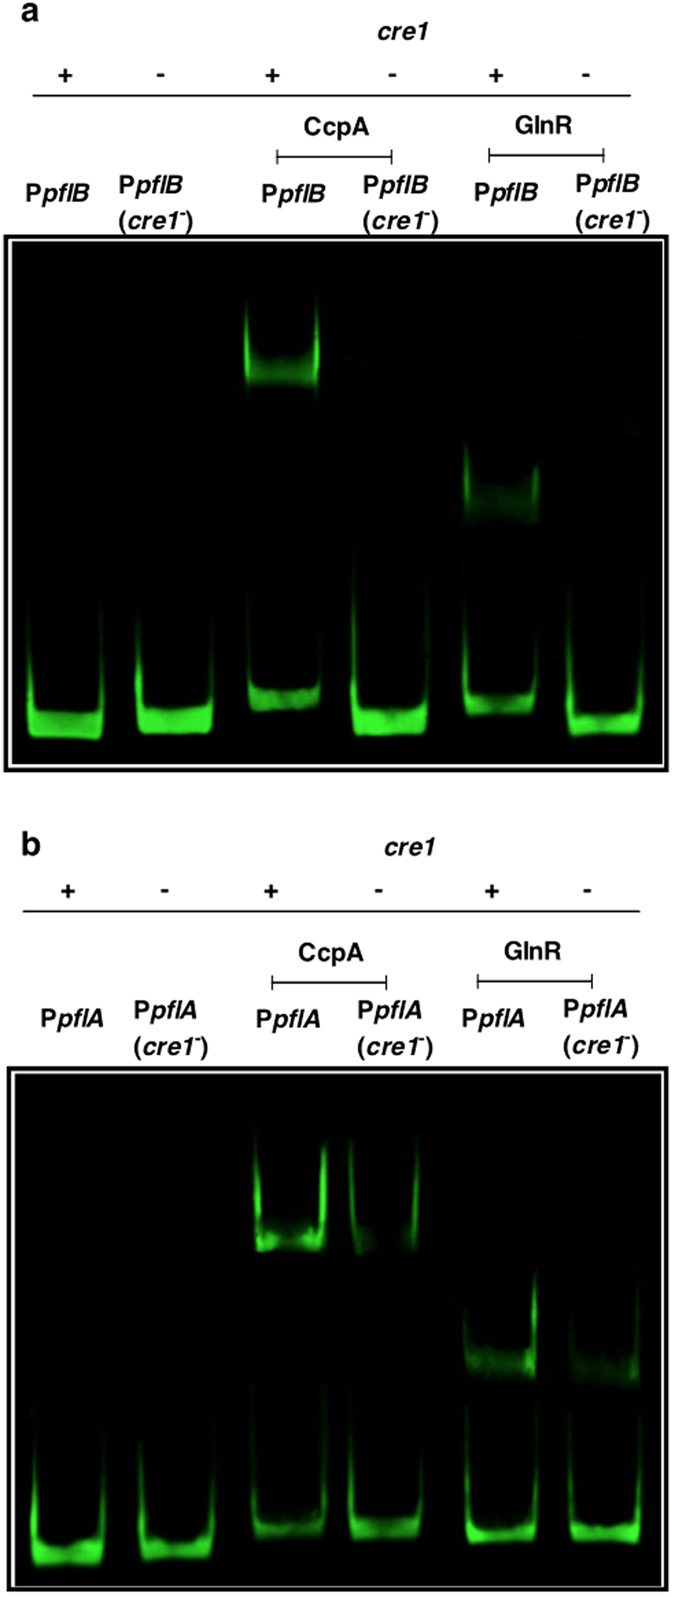
EMSA analysis showing sequence specificity of CcpA, and GlnR for the cre1 sites in (a) PpflB and (b) PpflA. Each lane contains approximately 30 ng of promoter probes, and 0.5 μM of CcpA or GlnR.

EMSA analysis showing sequence specificity of CcpA, and GlnR for the cre1 sites in (a) PpflB and (b) PpflA. Each lane contains approximately 30 ng of promoter probes, and 0.5 μM of CcpA or GlnR.