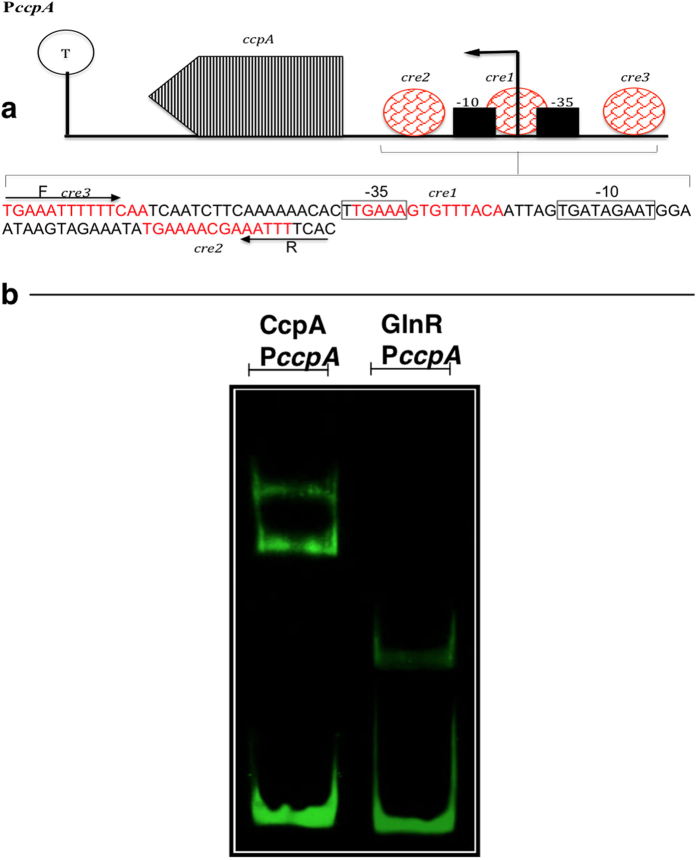
Figure 5.
(a) Schematic representation showing the analysis of predicted promoter region and binding sites of PccpA, and (b) EMSA analysis showing the direct interaction of CcpA and GlnR with PccpA. (a) The core promoter region containing the −10 and −35 elements is indicated. The putative cre sequences are indicated in red. F: indicates forward primer while R: refers to the reverse primer used for amplifying the promoter probe. T: potential terminator structure. The black arrow presents the direction of transcription. (b) Each lane contains approximately 30 ng PccpA; 0.5 μM of CcpA or GlnR as appropriate.

