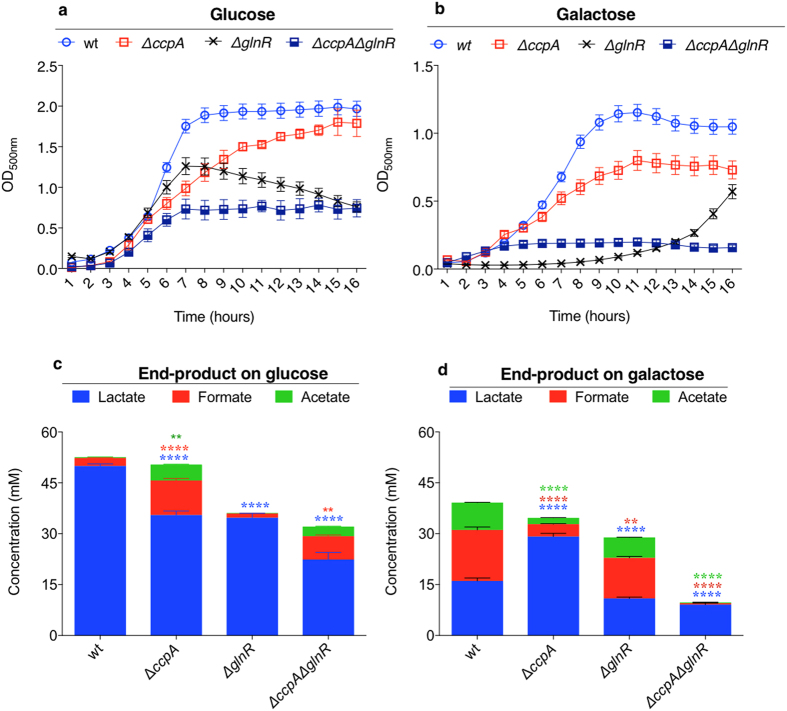
Figure 6. Pneumococcal growth and fermentation end products after culture anaerobically in CDM supplemented with different sugars.
(a) shows growth in 55 mM glucose and (b) in galactose. (c) and (d) show fermentation end product profiles after growth on glucose and galactose, respectively. Error bars show the standard error of the mean for three individual measurements each with three replicates. Significant differences were seen comparing the growth rates, and the fermentative profile of mutant strains to the wild type D39 using ANOVA followed by Dunnett’s multiple comparison test. **p < 0.01 and ****p < 0.0001.

