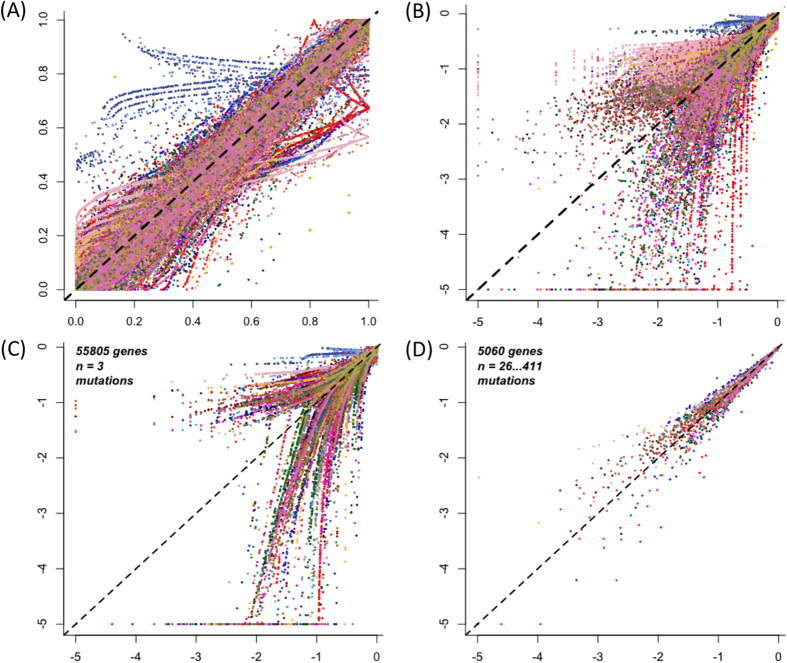
Figure 3. Comparison of the p-value estimations from VALORATE and the ALRT in cancer datasets.
(A) p-Value estimated by VALORATE (horizontal axis) and the ALRT (vertical axis). (B) Same than (A) in logarithm base 10 scale to highlight region of significance. Only genes having 4 or more mutations are shown. (C) The p-values for genes having 3 samples mutated. (D) The p-values for genes having more than 25 sample mutated.

