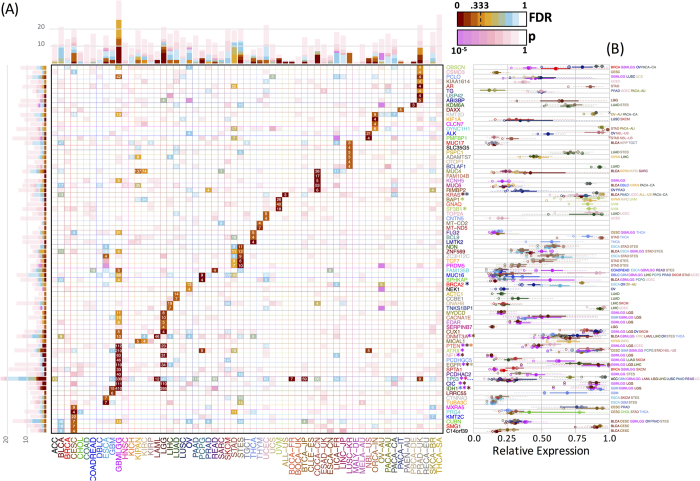
Figure 6. Significant genes across cancer types detected by VALORATE.
(A) Map of genes detected (vertical) across cancer types (horizontal). The color shades (from brown to orange and cyan) in each cell correspond to FDR q-value when less than 0.9 in which case the number of mutated samples is also shown. In cases where FDR > 0.9, the p-Value is shown in shades of pink. The bars show the accumulated number of cancer types for genes (left bars) or genes for cancer types (top bars). For Gliomas (GBMLGG) and Low-Grade Gliomas (LGG) only the top 10 genes are shown. The genes marked with an asterisk (*) have been reported as significant in FireBrowse (http://firebrowse.org). (B) Gene expression levels of the significant genes in those cancer types whose FDR > 0.9 and whose gene expression values were available. The filled circles represent the median (50%) of the expression level and the continuous line the 25% and 75% using all samples. The crossed circles represent the median (50%) of the expression level and the dotted line the 25% and 75% from the mutated samples. The smaller hollow circles represent the lowest expression value from the mutated samples.

