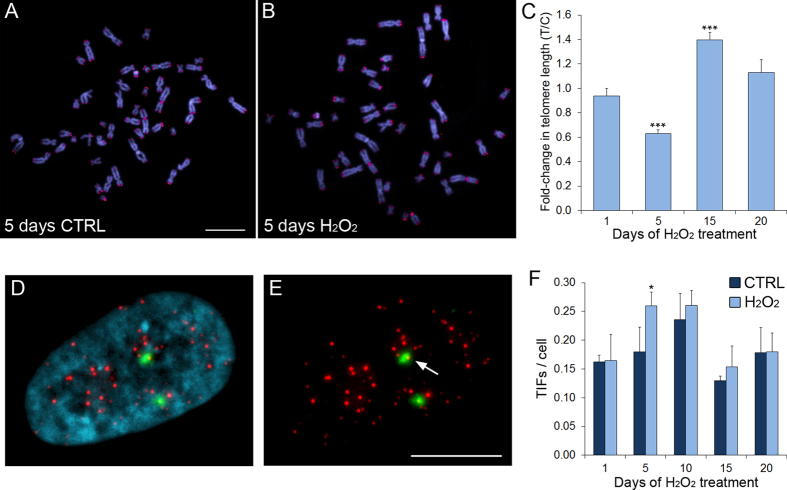
Figure 1. Prolonged low-level oxidative stress induces fluctuating changes in telomere length.
(A) Telomere FISH staining of control MRC-5 cell metaphase spread. (B) Telomere FISH staining of metaphase spread from MRC-5 cells treated with 10 μM H2O2 for 5 days. In (A and B) DNA is shown in blue, whereas telomere and chromosome 2 centromere staining is shown in red. Scale bar, 5 μm. (C) Quantification of the change in T/C ratio (see Materials and Methods for details on Q-FISH analysis) in H2O2-treated cells compared to control cells. The normalized (over control) data are reported as mean ± s.e.m. Asterisks denote statistical significance (Mann Whitney U test, ***p < 0.0001). (D,E) Telomere dysfunction-induced foci (TIFs) in nucleus of MRC-5 cell. DNA is shown in blue, telomeres in red, and γ-H2AX foci in green. Arrow in (E) points to instance of γ-H2AX/telomere colocalization (TIF). Scale bar, 5 μm. (F) Quantification of TIFs. The data are reported as mean ± s.e.m. Asterisk denotes statistical significance (Fisher’s exact test, *p = 0.05).

