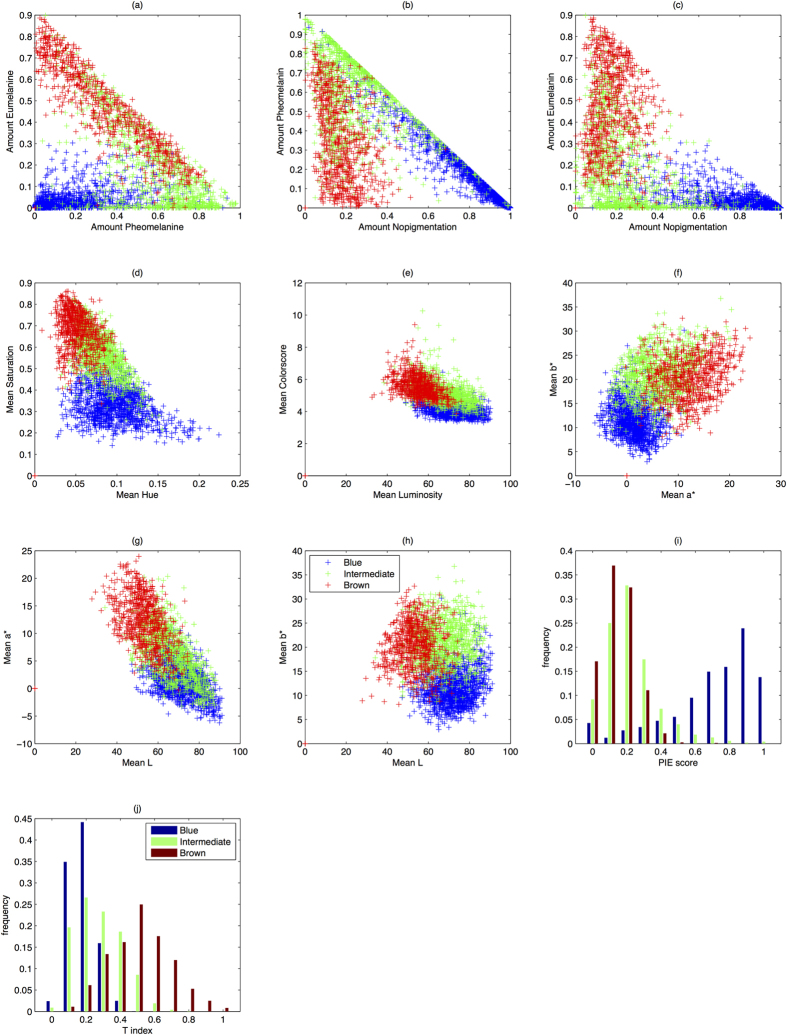
Figure 2. Manually categorized irises from the entire study population (N = 3087) into 3 eye colour categories blue (depicted in blue colour), intermediate (depicted in green colour), and brown (depicted in red colour) as arranged in the colour space of different quantification approaches for eye colour.
Each data point depicts one individual iris categorized in one of the eye colour categories in the respective continuous colour space. Panels (a–h) depict the separation of the manually graded eye colours in two-dimensional continuous colour spaces, e.g. Pheomelanin vs. Eumelanin. Panels (i,j) depict the separation of manually graded eye colours on one-dimensional colour spaces, i.e PIE score and T-index respectively.

