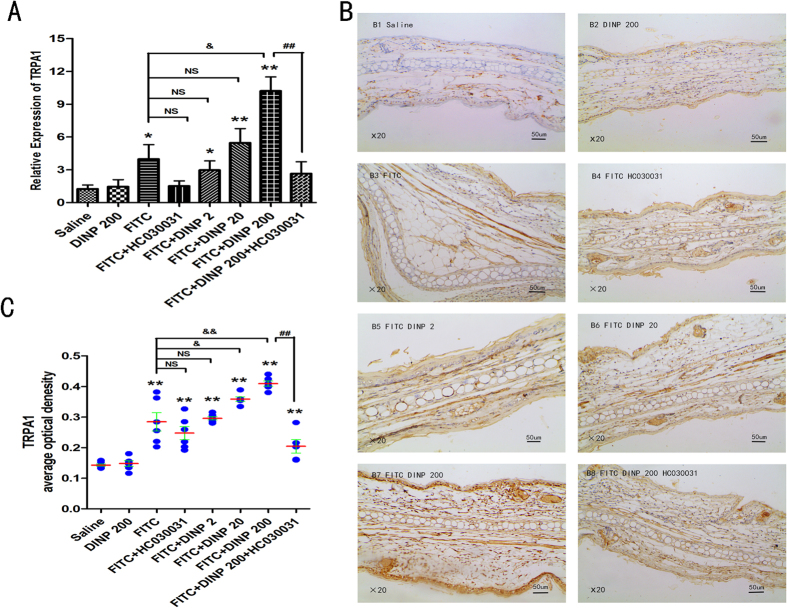
Figure 1. DINP exacerbated expression of TRPA1 and HC030031 inhibited this effect.
(A) The expression levels of TRPA1 mRNA. (B) Immunohistochemistry for TRPA1. (C) The expression scores of TRPA1. *p < 0.05, **p < 0.01, compared with saline group. NS, no significant difference, &p < 0.05, &&p < 0.01 compared with FITC group. ##p < 0.01, FITC + DINP200 group versus FITC + DINP200 + HC030031 group. (n = 7). Saline group, mice were gavaged with saline for 3 weeks, then sensitized and challenged with saline and vehicle; DINP200 group, mice were gavaged with 200 mg/(kg·d) of DINP for 3 weeks, then sensitized and challenged with saline and vehicle saline; FITC group, mice were gavaged with saline for 3 weeks, then sensitized and challenged with 0.5% FITC; FITC + HC030031 group, mice were gavaged with saline for 3 weeks, on days 22, 23 and 28, HC030031 was injected (50 mg/kg, i.p.) before sensitization and challenge with 0.5% FITC; FITC + DINP2, FITC + DINP20, FITC + DINP200 groups, mice were gavaged with 2, 20 and 200 mg/(kg·d) dose of DINP for 3 weeks, then sensitized and challenged with 0.5% FITC; FITC + DINP200 + HC030031 group, mice were gavaged with 200 mg/(kg·d) dose of DINP for 3 weeks, on days 22, 23 and 28, HC030031 was injected (50 mg/kg, i.p.) before sensitization and challenge with 0.5% FITC.

