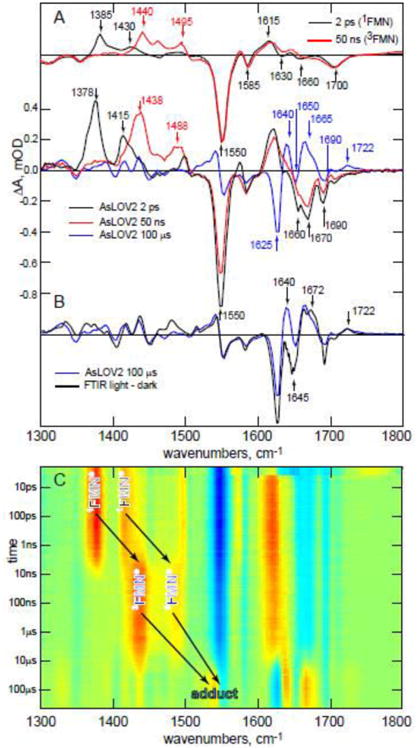
Figure 2. TRIR difference spectra of AsLOV2 between 1 ps and 100 μs.

A. Upper panel, the experimental TRIR spectra for FMN in buffer at 2 ps (black) and 50 ns (red) compared (lower panel) with key stages in the AsLOV2 photocycle (2 ps; red, 50 ns; blue, 100 μs; green). 2B. The 100 μs TRIR spectrum of AsLOV2 compared with the steady state FTIR difference spectrum recorded after continuous irradiation. C. A 2D a red-blue ‘heatmap’ representation of the complete TRIR data showing three distinct regions ascribed to singlet, triplet and adduct. Yellow – red indicates a transient absorption, blue a bleach.
