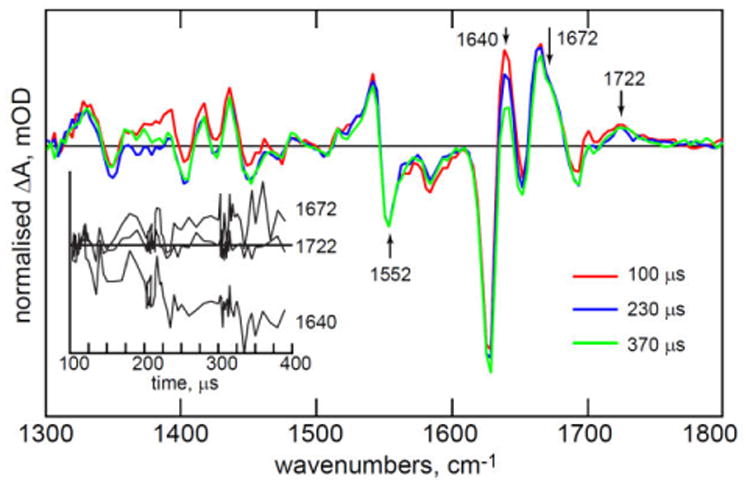
Figure 5. Long Time Apoprotein Structural Evolution.

Evolution of the 1540 cm-1 normalised TRIR spectra measured for hundreds of microseconds after adduct formation, showing continued evolution in the protein structure. Kinetics at key wavenumbers are shown as an inset. Irregular spacing of data points in the inset reflects collection of more data at early time and the multiplex nature of the TRMPS experiment.22
