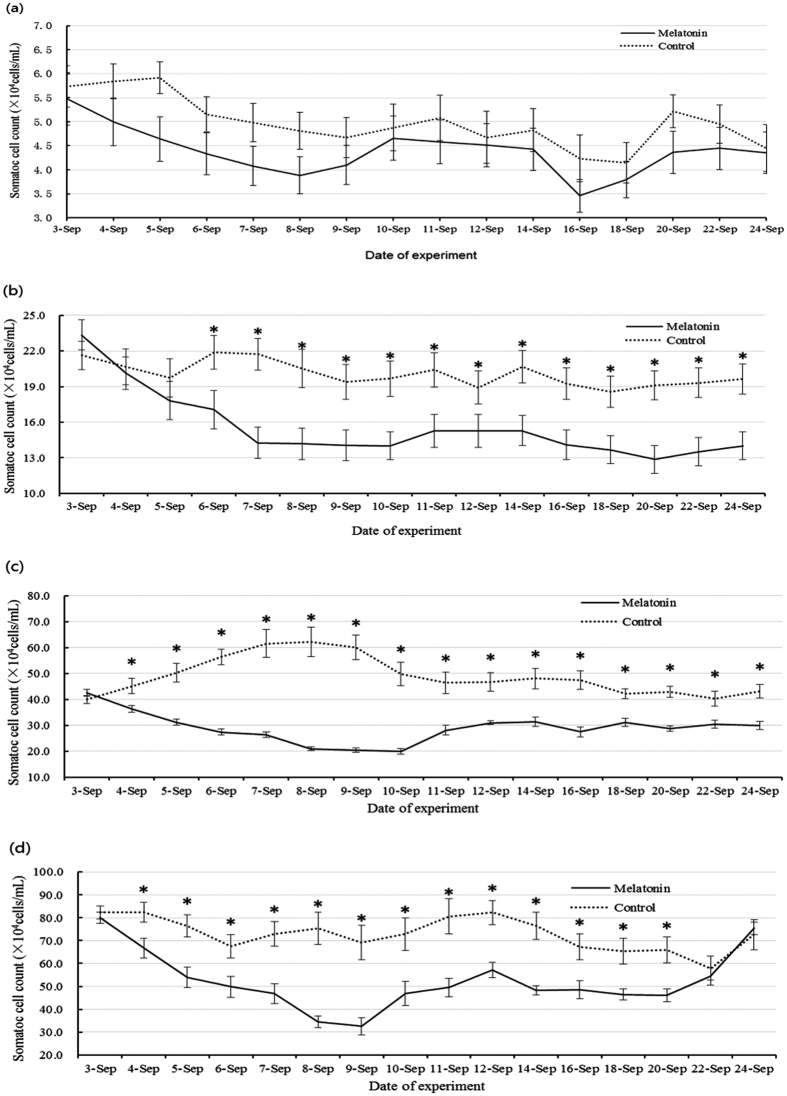
Figure 1. Changes in milk SCC following the subcutaneous injection of melatonin into cows over four consecutive days.
(a) Cows with milk SCC below 1 × 10⁵ cells/mL; this group served as healthy controls. (b) Cows with milk SCC ranging from 1 × 10⁵ to 3 × 10⁵ cells/mL. (c) Cows with milk SCC ranging from 3 × 10⁵ to 5 × 10⁵ cells/mL. (d) Cows with milk SCC ranging from 5 × 10⁵ to 1 × 10⁶ cells/mL. Melatonin was given on 3-Sep, 4-Sep, 5-Sep and 6-Sep. Data are expressed as the means ± SEM (n = 15). “*” represents significant differences (p < 0.05).

