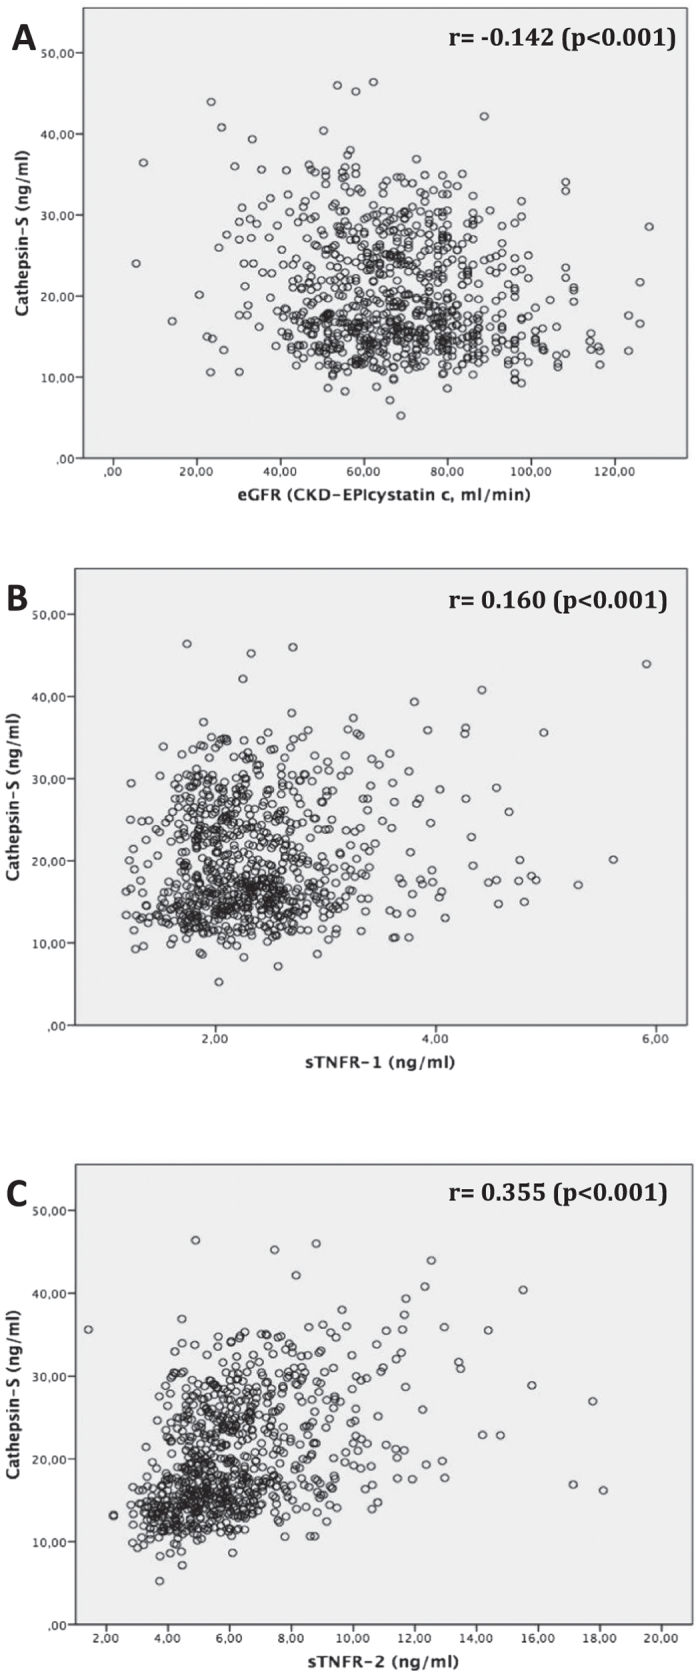
Figure 4.

PIVUS study; univariate correlation analysis using Pearson-correlation coefficient (r) to assess the association between serum cathepsin-S (in ng/ml) and (A) estimated glomerular filtration rate (eGFR CKD-EPIcystatin c, in ml/min/1.73 m2 body surface area); (B) serum soluble TNF receptor 1 (TNFR-1, in ng/ml); (C) serum soluble TNF receptor 2 (TNFR-2, in ng/ml).
