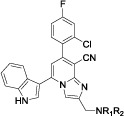
Table 2. Structures and cytotoxicity of compounds 7a–7 h.
 | ||||||
|---|---|---|---|---|---|---|
| Compd. | -NR1R2 | IC50 (μM) ± SDa | ||||
| HT29 | H460 | A549 | MKN45 | SMMC-772 | ||
| 7a |  |
0.04 ± 0.001 | 1.29 ± 0.21 | 5.34 ± 0.67 | 12.19 ± 1.89 | 26.98 ± 3.06 |
| 7b |  |
0.03 ± 0.003 | 0.96 ± 0.06 | 3.54 ± 0.41 | 20.47 ± 2.32 | 21.56 ± 3.16 |
| 7c |  |
0.33 ± 0.04 | 0.96 ± 0.07 | 6.18 ± 0.71 | 22.35 ± 2.51 | 36.67 ± 4.92 |
| 7d |  |
0.19 ± 0.02 | 0.71 ± 0.05 | 7.53 ± 0.63 | 16.56 ± 1.13 | 22.13 ± 3.41 |
| 7e |  |
0.21 ± 0.03 | 0.67 ± 0.05 | 4.87 ± 0.38 | 13.75 ± 1.79 | 24.61 ± 2.73 |
| 7f |  |
0.56 ± 0.07 | 0.85 ± 0.06 | 20.28 ± 2.32 | 1.63 ± 0.28 | 11.35 ± 2.15 |
| 7g |  |
0.19 ± 0.02 | 1.32 ± 0.12 | 8.79 ± 0.62 | 19.17 ± 1.35 | 42.57 ± 4.12 |
| 7h |  |
0.92 ± 0.14 | 1.27 ± 0.14 | 16.86 ± 1.98 | 36.31 ± 5.15 | 28.68 ± 1.79 |
| CA-4 | 0.05 ± 0.01 | 0.08 ± 0.01 | 0.43 ± 0.053 | 0.11 ± 0.02 | 1.92 ± 0.11 | |
| Crolibulin | 0.52 ± 0.02 | 0.03 ± 0.007 | ND | 0.17 ± 0.03 | ND | |
aSD: standard deviation.
