Figure 4.
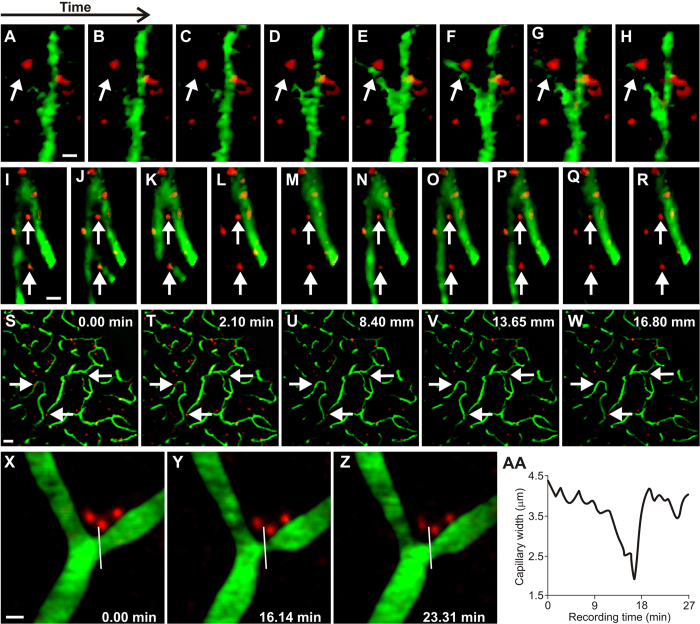
Analysis of mural cell vasoconstrictions in KA mice (A–H) In vivo fiber-optic confocal image of capillary vasospasm (vessels in green, labeled with 2MD fluorescein-conjugated dextran) colocalized to mural cells (red, labeled via intravenous vein tail injection of Alexa Fluor 647) in KA mice during seizure (arrow indicates mural cell and associated vasospasm). See Video S4. (I–R) Fiber-optic confocal image of capillary vasospasm colocalized to mural cells in WT mouse (arrow indicates mural cell and associated vasospasm). See Video S5 (S–W). In vivo two-photon scanning laser microscopy (TPLSM) stack of capillary vessels (green) and mural cells (red). See Video S6. (X–Z) In vivo TPLSM of a mural-cell-localized (red) capillary constriction. See Video S8. (AA) Quantification of vessel constriction from panels P-R measured at white line. Scales for panels A–R = 5 μM; S–W = 25 μM; X–Z = 5 μM.

