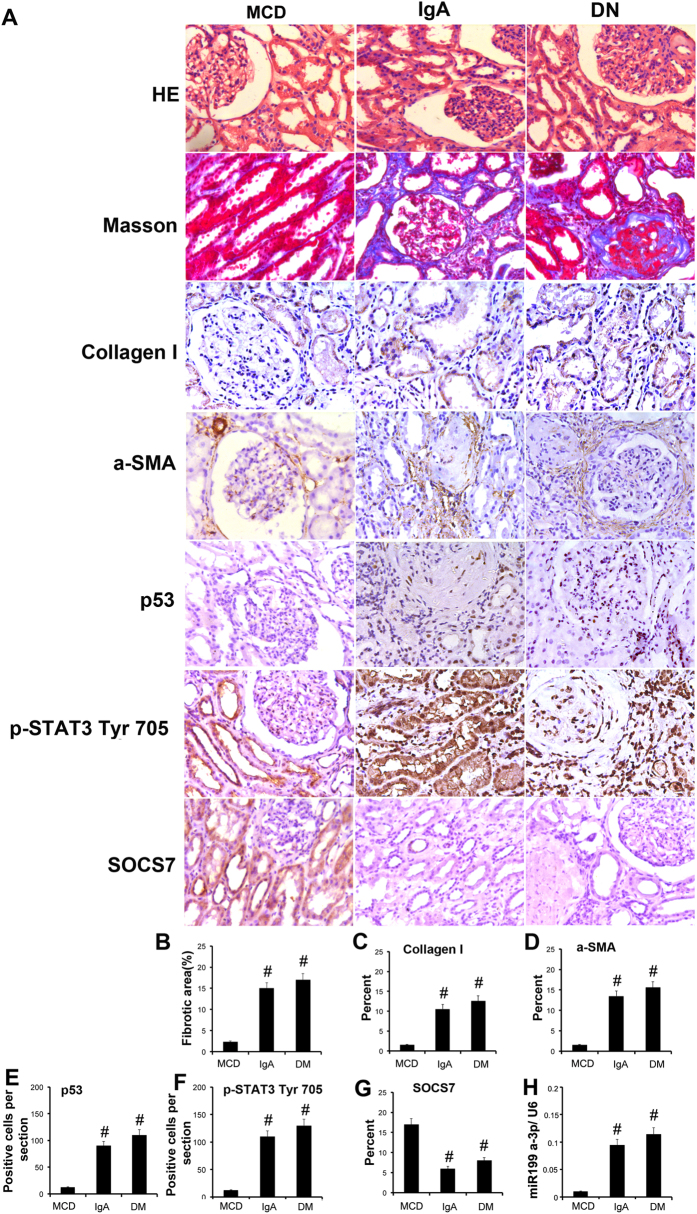
Figure 11. p53-induced related gene expression in patients with IgAN and DN.
The kidneys from patients of IgAN and DN were collected for hematoxylin and eosin staining to examine histology, Masson staining for fibrosis analysis and immunohistochemistry staining for p53, ECM related gene expression, p-STAT3 and SOCS7 (A). Quantification of the tubulointerstitial fibrosis (B) in the kidney cortex. Quantify immunohistochemistry staining (C–G). Real time PCR analysis of miR-199a-3p (H). Data were expressed as means ± sd (n = 6); #P < 0.05 versus MCD group. Original magnification, x200 or 400.

