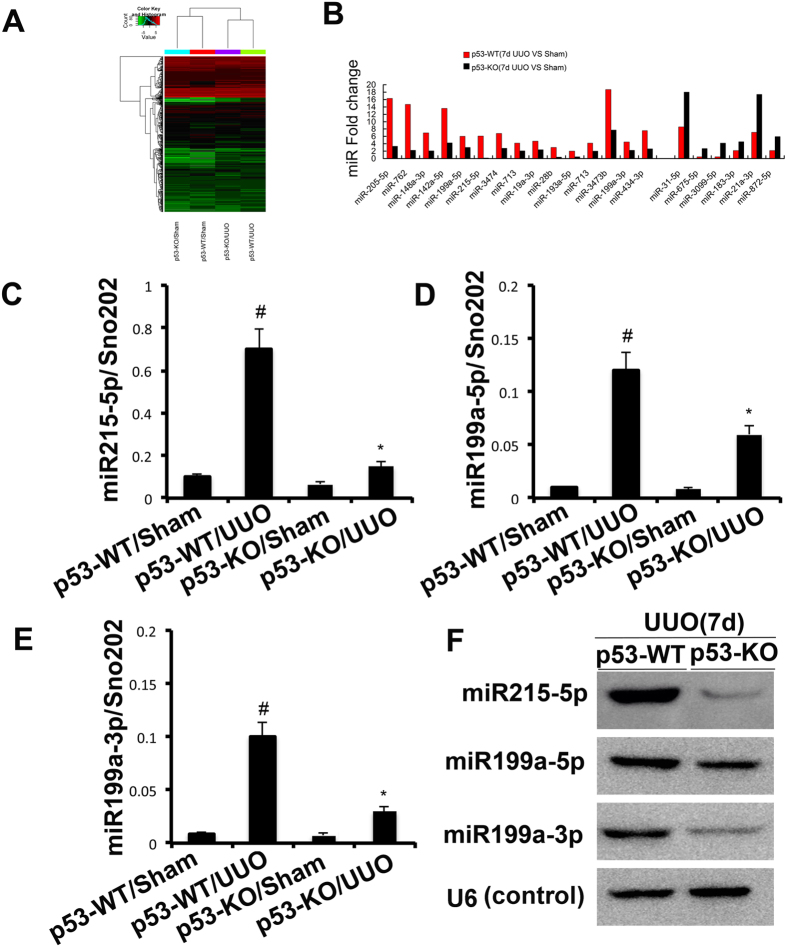
Figure 7. The induction of miR-215, miR-199a-5p, and miR-199a-3p after UUO was suppressed in PT-p53-KO mice.
WT (n = 6) and p53-KO (n = 6) littermate mice with UUO were kept for 7 days or sham operation as control. Total RNA was isolated from renal cortical tissues of WT and p53-KO littermate mice. (A) Representative heat map of microRNA microarray analysis. The ΔCt values of all miRNAs were used to generate the heat map. (B) The amount of each miRNA from the UUO group was divided by the amount of sham control to calculate the fold change. (C–E) Real-time PCR analysis of miR-215-5p, miR-199a-5p&3p. The value of each miRNA was normalized by the signal of snoRNU202, an internal control. (F) Northern blot analyses of miR-215, miR-199a-5p, and miR-199a-3p. Total RNA (10 μg per lane) was analyzed by Northern blotting as described in the concise Methods section using a 32p-labeled probe of miR-215, miR-199a-5p, and miR-199a-3p. U6 was shown as an RNA loading control. Data were expressed as means ± sd (n = 6); #p < 0.05: the UUO group vs the sham group; *p < 0.05: the PIF group vs the UUO group.

