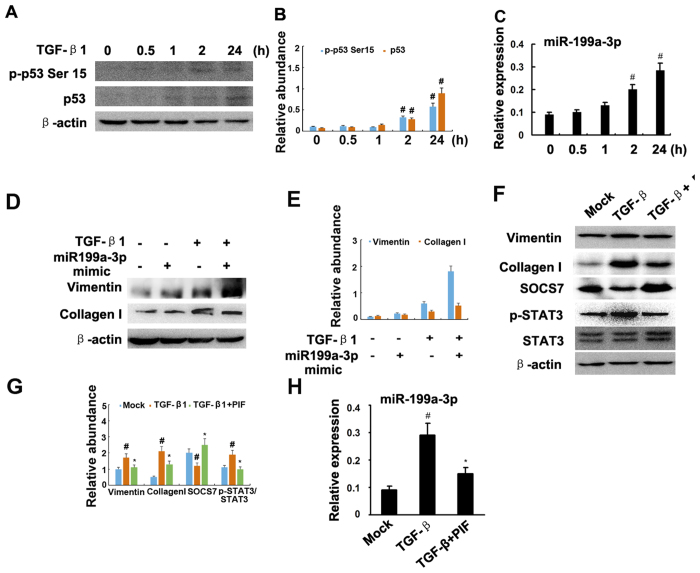
Figure 8. Pifithrin-α suppressed TGF-β1-induced STAT3 activation and miR-199a-3p expression.
Cultured HK-2 cells were treated with 10 ng/ml TGF-β1 or 10 μM pifithrin-a for 0 to 24 h or transfection of miR-199a-3p or negative control analog or SOCS7 siRNA, followed by immunoblot for p-STAT3, STAT3, and ECM genes, and real time PCR for miR-199a-3p. Immunoblot (A) analysis of p-p53 Ser15 and p53, densitometry (B) of proteins signals on immunoblots, and real time PCR analysis (C) of miR-199a-3p after indicated time point of treatment with TGF-β1. Relative protein levels (D) of vimentin, COL1, and β-actin 24 h after transfection of miR-199a-3p analog (100 nM) or miR analog negative control (miR-ANC) with or without TGF-β1 treatment, densitometry (E) of proteins signals on immunoblots. Immunoblot analysis (F) of vimentin, COL1, SOCS7, p-STAT3, STAT3 and β-actin, densitometry (G) of proteins signals on immunoblots, and real time PCR analysis (H) of miR-199a-3p 24 h after TGF-β1 alone or TGF-β1 plus pifithrin-a treatment. Data were expressed as means ± sd (n = 6); #p < 0.05: 2 h or 24 h vs 0 h, or TGF-β1 group vs mock group; *p < 0.05: TGF-β1 + PIF group vs TGF-β1 group.

