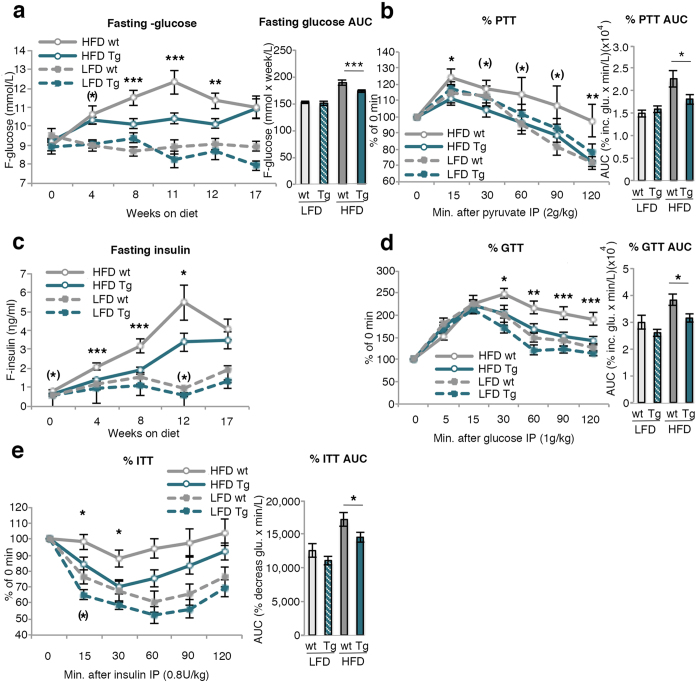
Figure 3. Characterization of glucose and insulin homeostasis.
(a) Fasting glucose during a 17 week period and area under the curve (AUC) was calculated (n = 24–40/group) (b) intraperitoneal pyruvate tolerance test (PTT) at 12 weeks on respective diet, calculated as percentage of the fasting value at time point 0. AUC was calculated from the PTT curve (n = 11–21/group). (c) Fasting insulin during a 17 week period (n = 24–39/group) (d) Intraperitoneal glucose tolerance test (GTT) and intraperitoneal insulin tolerance test (ITT) (e) at 11/12 weeks on diet, calculated as percentage of the fasting value at time point 0. AUC was calculated from the GTT and ITT curve (n = 11–18/group). The experimental data are presented as means ± SEM. ANOVA was used to compare ≤4 groups. ***p < 0.001, **p < 0.01, *p < 0.05, (*)p < 0.1.

