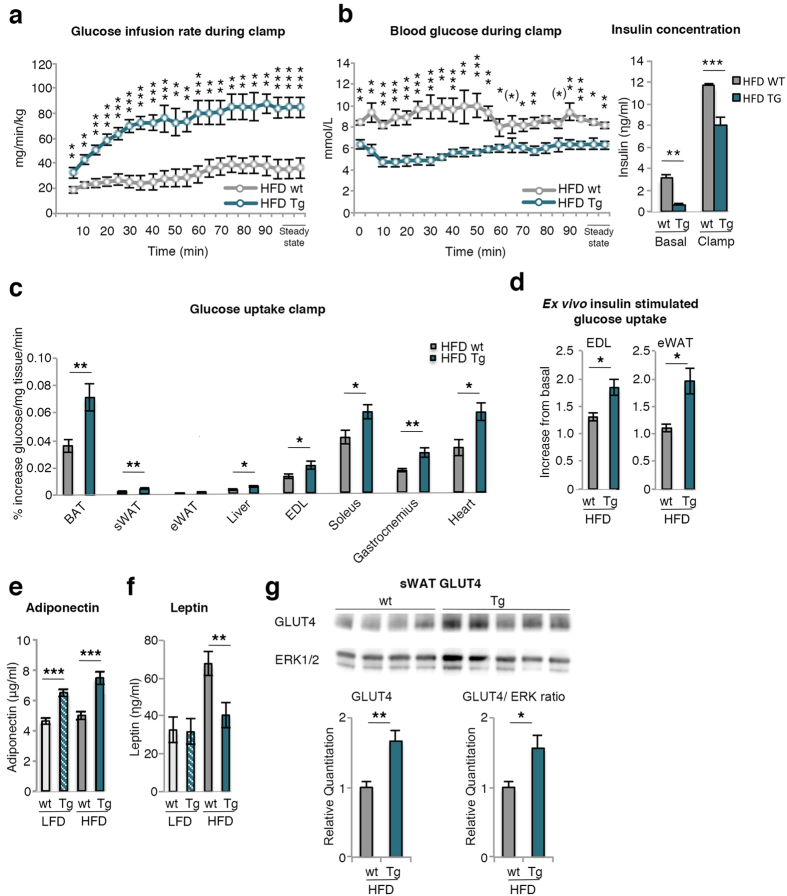
Figure 4. Hyperinsulinemic-euglycemic clamps, peripheral glucose uptake and serum adiponectin levels.
(a) Glucose infusion rate, (b) Blood glucose and insulin concentrations during hyperinsulinemic-euglycemic clamps in conscious mice on HFD. Steady-state values are at least 5 minutes apart where the glucose did not differ more than 10%, (c) [C14]-2-deoxyglucose uptake during clamp in BAT, sWAT, eWAT, liver, extensor digitorum longus muscle (EDL), soleus, gastrocnemius and heart (n = 6–10/group). (d) Ex vivo insulin-stimulated glucose uptake in EDL and eWAT measured in mice after 17 weeks on HFD (n = 3–6/group). (e) Serum levels of adiponectin and (f) Leptin were measured in mice after 17 weeks (n = 7–18/group). (g) GLUT4 protein in isolated mature sWAT from wt and Tg HFD mice (top) and related to ERK as loading control (below) (n = 4–5/group). Full-length blots are presented in Supplementary Fig. 7c. The experimental data are presented as means ± SEM. 2-way ANOVA was used to compare ≤4 groups; otherwise Student’s t-test was used. ***p < 0.001, **p < 0.01, *p < 0.05, (*)p < 0.1.

