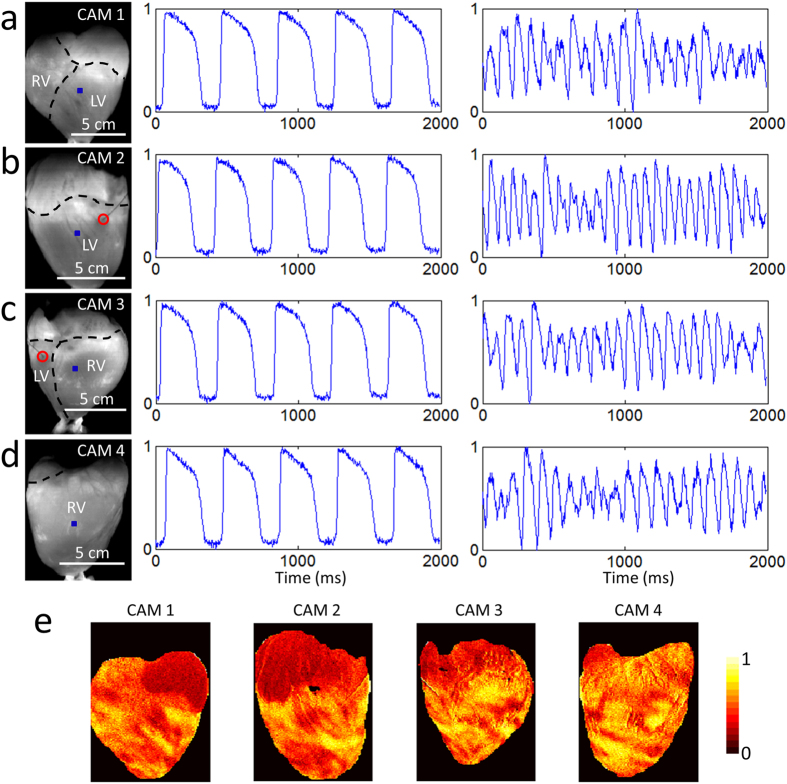
Figure 2. Optical Mapping System 1: Sample Data (Langendorff-Perfused Pig Heart).
Normalized fluorescence signals from the (a) anterior, (b) left lateral, (c) posterior and (d) right lateral points-of-view of the heart during electrical pacing (middle panel) and ventricular fibrillation (right panel), taken from the blue-square regions shown (left panel). In the left panels, the right ventricle, left ventricle and atria are demarcated by black dashed lines and the red circle indicates the location of electrical point stimulation. Each of the four cameras can be independently positioned and rotated to adjust and optimize the position of the heart in its field-of-view. The varying scale bars in the left panels reflects these adjustments. Signals are in arbitrary fluorescence units. (e) Normalized fluorescence intensity map (colorbar shown) at one time point during ventricular fibrillation.

