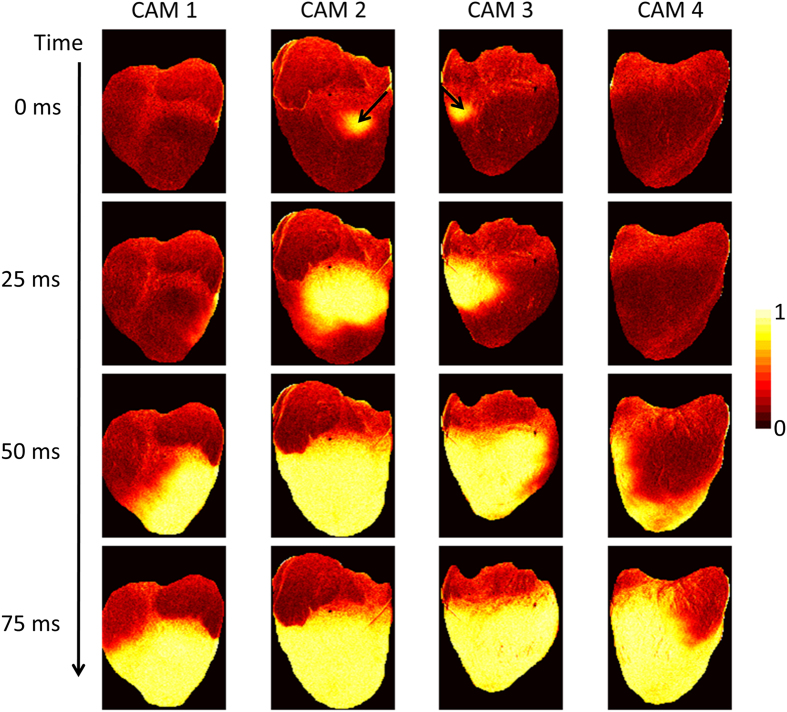
Figure 4. Optical Mapping System 1: Propagation Image Sequences (Langendorff-Perfused Pig Heart).
Normalized fluorescence intensity maps (colorbar shown) at progressive time points during electrical pacing (400 ms cycle length). The black arrows indicate the location of electrical point stimulation.

