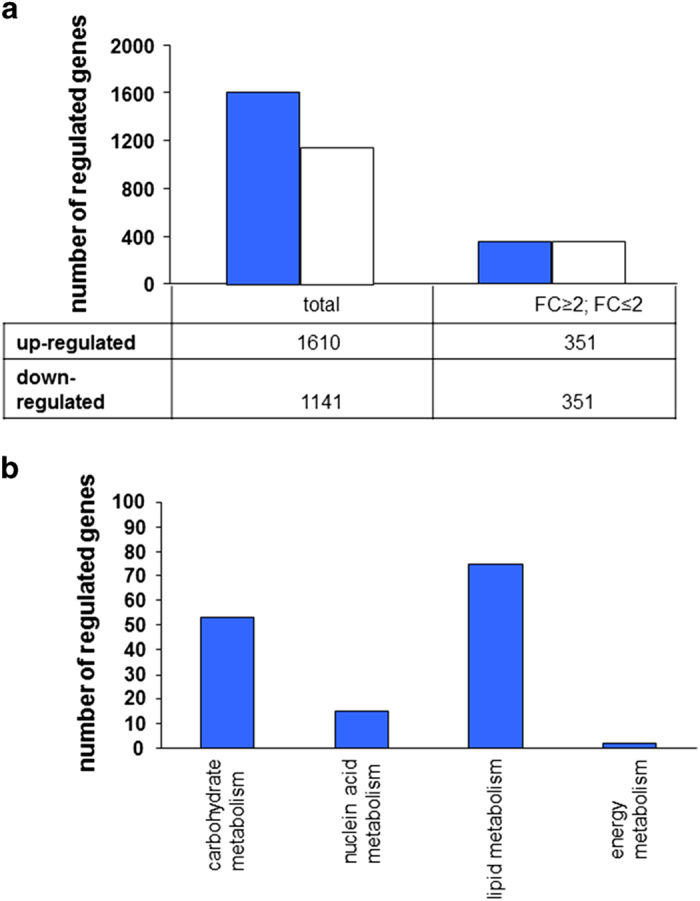
Figure 1.

Number of significantly regulated genes (a) and identification of significantly regulated pathways of the substrate and energy metabolism (b). The microarray analyses showed significant differences in the gene expression profile of IPEC-J2 (a). In the ALI cultures a downregulation of 1141 (FC<0) genes and an upregulation of 1610 (FC>0) genes was found. About 351 genes each were up- and downregulated minimum of two-fold (FC⩾2, FC⩽−2), which correlates to a doubling or bisection of the relative expression in the ALI cultures compared to SMC (P<0.05). The functional analyses of the microarray identified four different pathways, which are differently regulated in the ALI culture compared to SMC (b). The amount of significantly up- and downregulated genes in the pathways is shown. The statistical evaluation was done with a t-test (n=3; FC⩾2; FC⩽2; P<0.5).
