Figure 3.
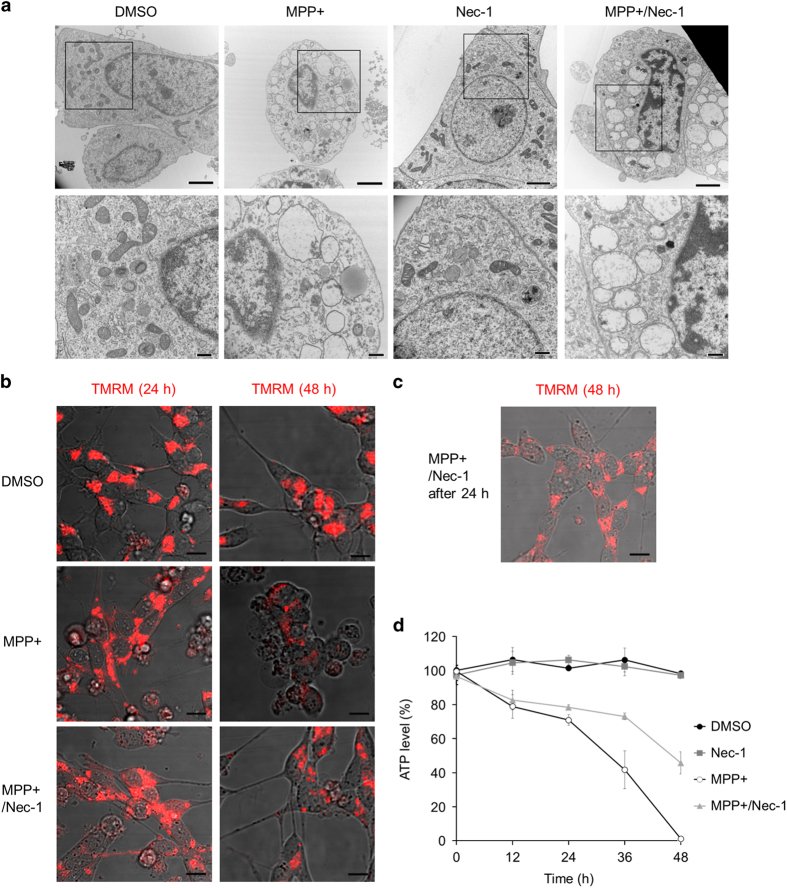
Changes of morphology and mitochondrial membrane potential during MPP+-induced cell death. (a) Neuronal SH-SY5Y cells were treated with MPP+ (5 mM) or dimethyl sulfoxide (DMSO) (control) for 40 h in the presence or absence of Nec-1 (20 μM) and subjected to transmission electron microscopy. Scale bar=2 μm (upper photos) or 500 nm (lower photos). (b) Representative TMRM staining to assess the mitochondrial membrane potential in neuronal SH-SY5Y cells. Cells were treated with MPP+ (5 mM) or DMSO (control) in the presence or absence of Nec-1 (20 μM) for 24 h (left) or 48 h (right), stained with TMRM (250 nM), and subjected to confocal fluorescence microscopy. Scale bar=10 μm. (c) Cells were treated with MPP+ (5 mM) for 48 h and Nec-1 (20 μM) was added after 24 h treatment of MPP+. Scale bar=10 μm. (d) Cells were treated with or without MPP+ (5 mM) in the presence or absence of Nec-1 (20 μM). ATP was measured by the CellTiter-Glo cell viability assay at the indicated time. Data are shown as the mean±S.D. of three independent experiments.

