Fig. 1.

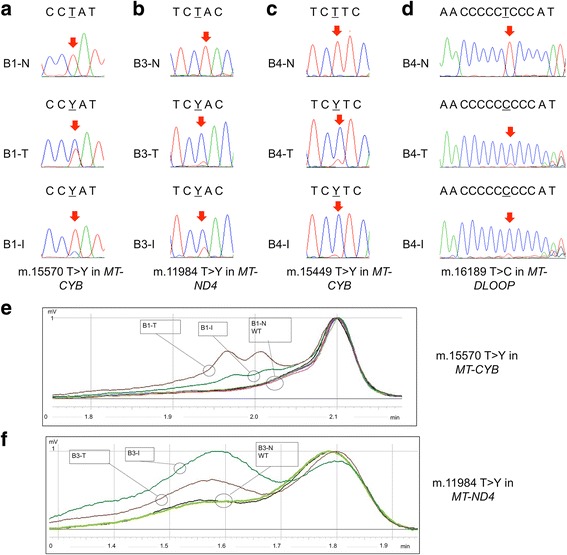
Mitochondrial DNA sequencing in BOTs and implants (a, b, c, d). Electropherograms of mitochondrial loci harboring mutations in BOT and peritoneal implant samples. Red arrows indicate the mutated bases. (e, f) Representative dHPLC elution profiles for the in-depth investigation of the somatic nature of mitochondrial DNA mutations m.15570 T > Y/MT-CYB in case B1 and m.11984 T > Y/MT-ND4 in case B3. Homo- and hetero-duplexes are distinguished based on different retention times. (e) Two elution curves for T (Tumor) and I (Implant) (heteroduplex and homoduplex) and a single elution curve for non-tumor tissue (N) and three wild-type controls are present in the analysis of m.15570 T > Y/MT-CYB in case B1. Wild-type (black, pink and purple), N (light green), I (green), T (brown). (f) Two elution curves for T and I (heteroduplex and homoduplex) and a single elution curve for non-tumor tissue (N) and one wild-type control are present in the analysis of m.11984 T > Y/MT-ND4 in case B3. Wild-type (black), N (light green), I (green), T (brown)
