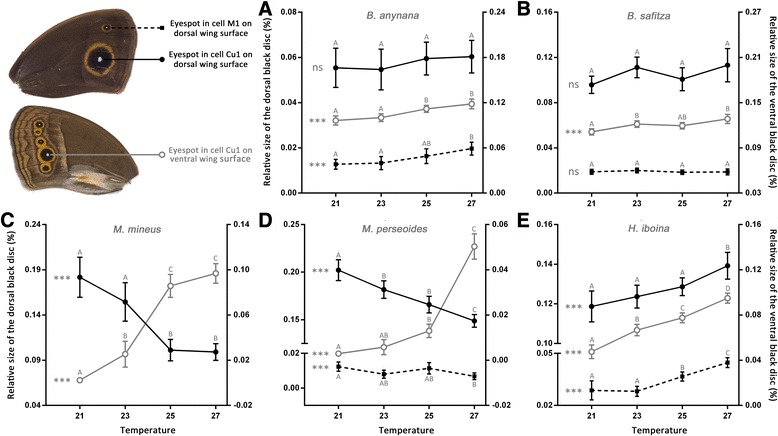
Fig. 4.

Effects of developmental temperature on the relative size of the black disc on both surfaces of the forewing for (a) B. anynana, (b) B. safitza, (c) M. mineus, (d) M. perseoides and (e) H. iboina. Data represent males but similar results were obtained for females. Filled symbols indicate the dorsal eyespots, with the solid line representing the black disc of the large eyespot in cell Cu1 (element 7) and the dashed line the smaller eyespot in cell M1 (element 6). Both these traits are associated with the left hand axis. The open symbols and grey lines represent the black disc of the large eyespot on the ventral wing surface (element 2). These values are associated with the right hand axis. Statistical significance for effects of temperature on the wing trait is indicated to the left of each reaction norm: ns (non-significant) P > 0.05, * p < 0.05, ** p < 0.01, *** p < 0.001. Error bars represent 95% confidence intervals and significant differences across the temperature treatments (Tukey’s HSD, p < 0.05) are indicated by different letters, coding for each trait separately
