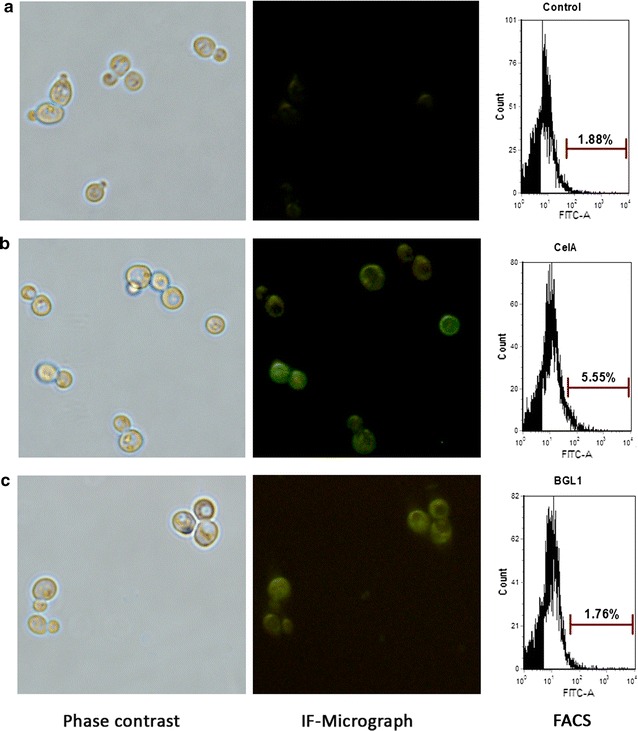
Fig. 3.

Immunofluorescence micrographs and FACS analysis of the surface display of CelA and BGL1. a Immunofluorescence micrographs and FACS analysis of the control strain with empty plasmid. b Immunofluorescence micrographs and FACS analysis of the displayed BGL1. c Immunofluorescence micrographs and FACS analysis of the displayed CelA. The results are representative of two independent experiments using two individual clones
