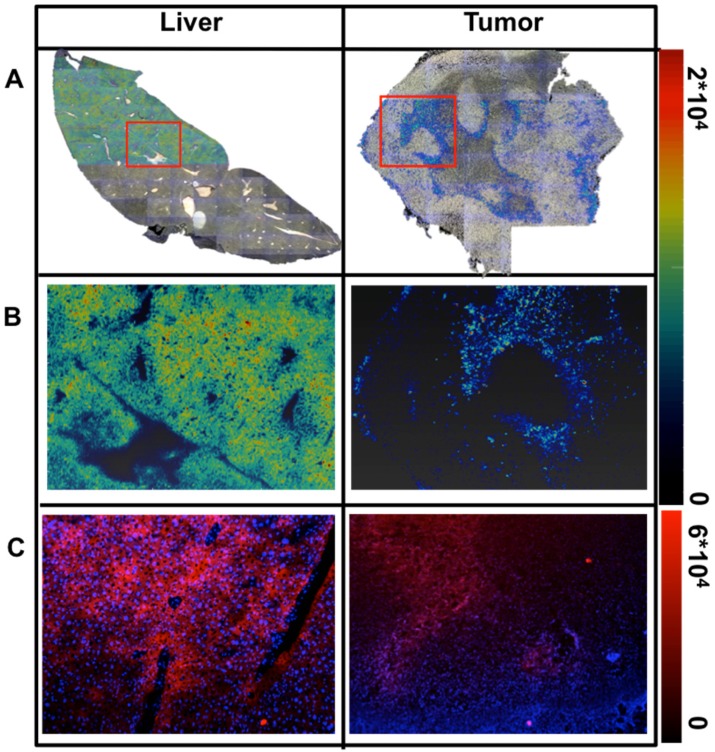
Figure 3.
Ex vivo analysis of the distribution of hybrid-Cy5-Ac-TZ14011 in tissue sections. A) Color overlay of the 165Ho-signal intensity map as obtained using LA-ICP-MS on standard photographic images of the whole tissue section (max intensity: 2*104 165Ho atoms). Individual images were obtained using a 2.5x magnification, the complete overview was obtained after stitching of these images. B) More detailed 165Ho signal intensity map of the area within the red rectangle. The linearly scaled color bar on the right presents the 165Ho signal intensity. C) Fluorescence images of consecutive tissue sections at 5x magnification showing a more detailed staining pattern (max pixel intensity: 6*104). Cell nuclei were stained blue using DAPI containing Proline Gold mounting medium.

