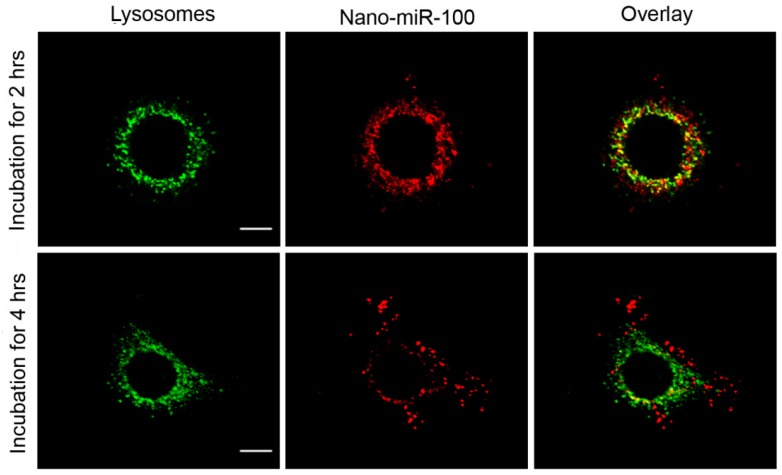
Figure 5.
Confocal microscopy images of HN-13 cells stained by LysoTracker green at two different time points after exposure to nano-miRNA-100 (P MMNCs-miR-100). Lysosomes in green and miR-100 in red. Scale bar, 10 μm. Figure 4. PMMNCs-MiR-100 Complex Cellular Uptake. (A) Confocal fluorescent microscope images of HN-13 cells treated with Nano-miR-100 (PMMNCs-miR-100) for indicated time. CD44 was labeled in green and miR-100 in red; nuclei were counterstained with DAPI (blue). Scale bar, 10 μm. (B) Quantification of the miR-100 expression level in HN-13 cells delivered by PMMNCs loaded with miR-100 (nano-miR-100) at different concentrations (10 and 100 pmols) and pure PMMNCs and control by qPCR assay. (C) Western blot analysis showing that nano-miR-100 transfection significantly decreased the protein expression of miR-100 target gene FGFR3. All error bars indicate standard deviation. *, p<0.01 versus the control group.

