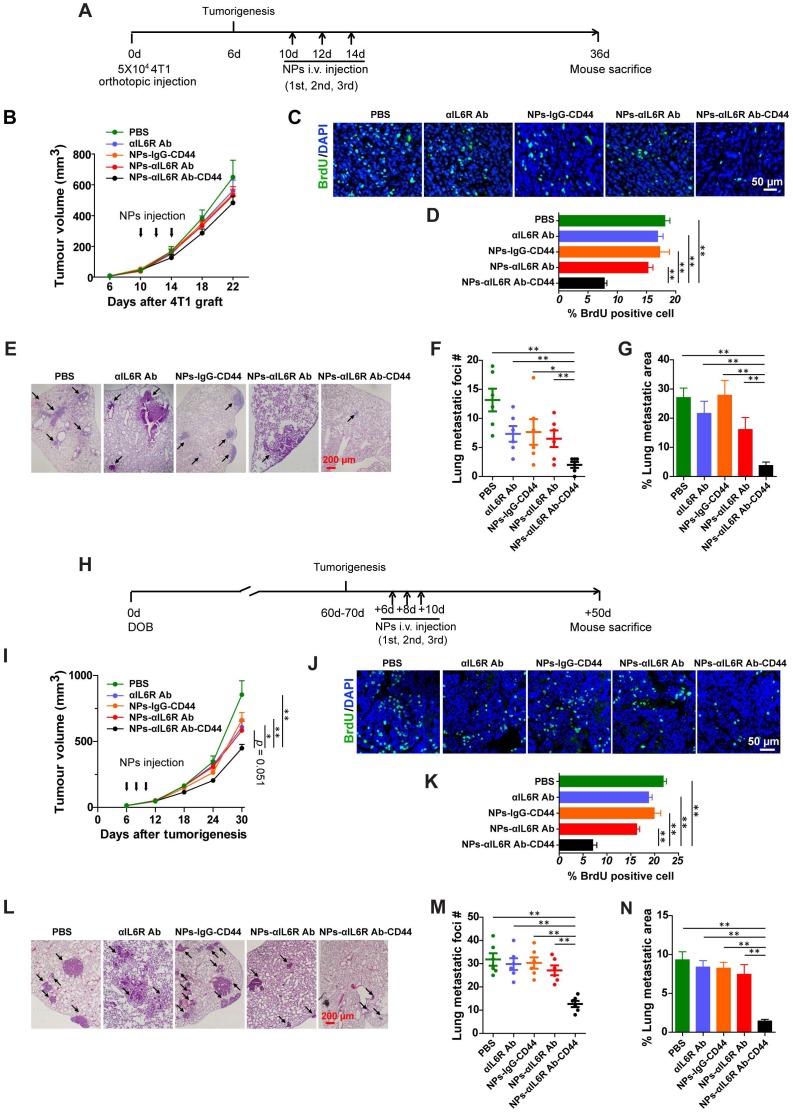
Figure 4.
Inhibited tumour metastasis in BALB/c and MMTV-PyMT mice treated with NPs-αIL6R Ab-CD44. A. Schematic diagram of the experimental procedure in BALB/c mice. B. Growth curve of the 4T1 xenografts in BALB/c mice treated with NPs-αIL6R Ab-CD44 and the controls. Data were presented as the mean + standard error of the mean (SEM, n = 6 mice). C. Immunofluorescent staining of BrdU in 4T1 tumour xenografts of BALB/c mice. D. Statistics of the percentage of BrdU positive cells in 4T1 tumour xenografts. Data were presented as the mean + SEM, n = 6 mice. E. Representative HE staining of metastatic foci in the lung tissues of the BALB/c mice. Statistical results shown for the number (#) of metastatic foci (F, data were presented as the mean ± SEM, n = 6 mice) and the relative percentage of metastatic foci area (G, data were presented as the mean + SEM, n = 6 mice) in the lung of BALB/c mice. H. Schematic diagram of the experimental procedure for MMTV-PyMT mice. DOB, Day of Birth. I. Tumour growth curve in the MMTV-PyMT mice treated with NPs-αIL6R Ab-CD44 and the controls, data were presented as the mean + SEM, n = 6 mice Statistical analysis was performed to determine the significance of tumour volume on the 30th days after tumorigenesis. J. Immunofluorescent staining of BrdU in tumour tissues of MMTV-PyMT mice. K. Statistics of the percentage of BrdU positive cells in tumour tissues of MMTV-PyMT mice treated with NPs-αIL6R Ab-CD44 and the controls, data were presented as the mean + SEM, n = 6 mice. L. Representative HE staining of metastatic foci in the lung tissues of MMTV-PyMT mice. Statistical results for the number of metastatic foci (M, data were presented as the mean ± SEM, n = 6 mice) and the relative percentage of metastatic foci area (N, data were presented as the mean + SEM, n = 6 mice,) in the lung of MMTV-PyMT mice.

