
FIGURE 4.
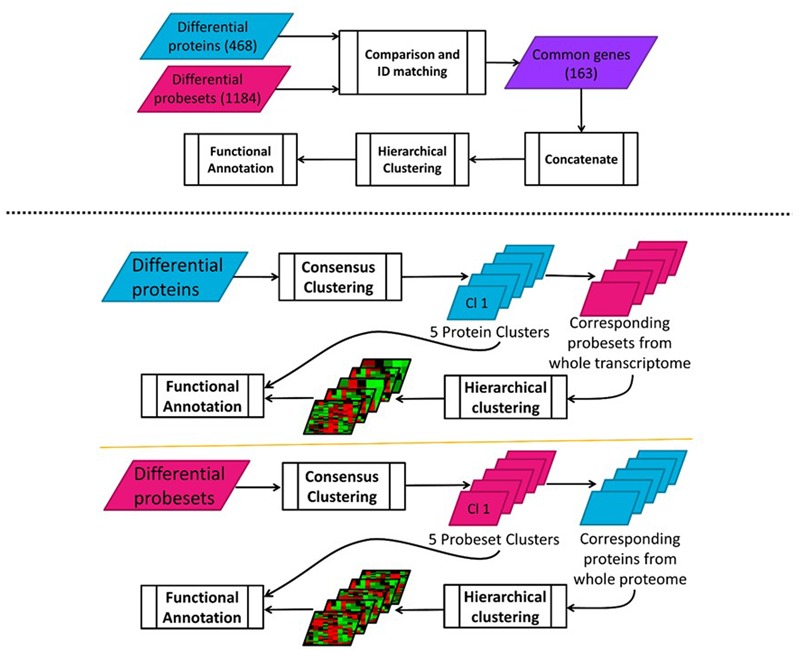
(Top) Clustering of concatenated transcriptomic-proteomic MPL data workflow; (Bottom) Sequential transcriptomic and proteomic – forward and reverse – clustering analysis of MPL data workflow.
Official websites use .gov
A
.gov website belongs to an official
government organization in the United States.
Secure .gov websites use HTTPS
A lock (
) or https:// means you've safely
connected to the .gov website. Share sensitive
information only on official, secure websites.
(Top) Clustering of concatenated transcriptomic-proteomic MPL data workflow; (Bottom) Sequential transcriptomic and proteomic – forward and reverse – clustering analysis of MPL data workflow.