
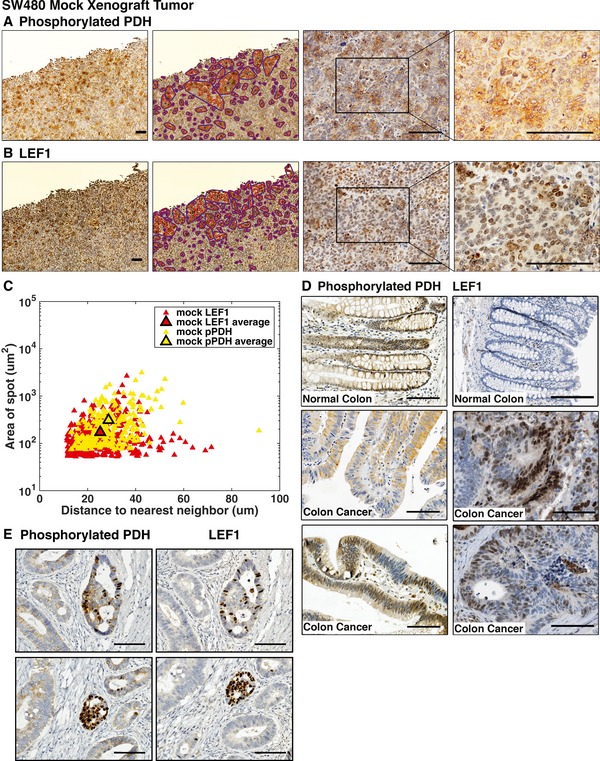
Figure 1. SW480 xenograft tumors reveal a spotted pattern of metabolic heterogeneity.
-
A, BSW480 cells lentivirally transduced with empty pCDH vector (mock) were subcutaneously injected into immunocompromised mice. The resulting tumors were stained for (A) phosphorylated pyruvate dehydrogenase (pPDH) and counterstained with hematoxylin or (B) lymphoid enhancer factor‐1 (LEF‐1). Scale bars indicate 100 μm in the series of 4×, 20×, and 40× images. The red curves denote spot contours and the blue curves denote convex hulls, which group together spots that are sufficiently close to one another (see Appendix A1).
-
CImage analysis of spot size versus distance of spot to nearest neighbor, using analyzed 20× images (third panels of A and B). The outlined data points indicate the average distance and area for pPDH and LEF‐1 spots. Results show that quantifiable features of the spotted patterns in pPDH and LEF‐1 are similar.
-
DColorectal carcinoma patient samples (tumors 1, 2, and 3) stained for pPDH (top) and LEF‐1 (bottom) show spatial heterogeneity in expression levels. Scale bars are 100 μm (LEF‐1 samples from Uhlén et al, 2015).
-
ESerial section of human colorectal carcinoma stained with pPDH and LEF‐1 antisera. Scale bars are 100 μm.