
Figure EV1. Overlap of pPDH and LEF1 spots in xenograft tumors.
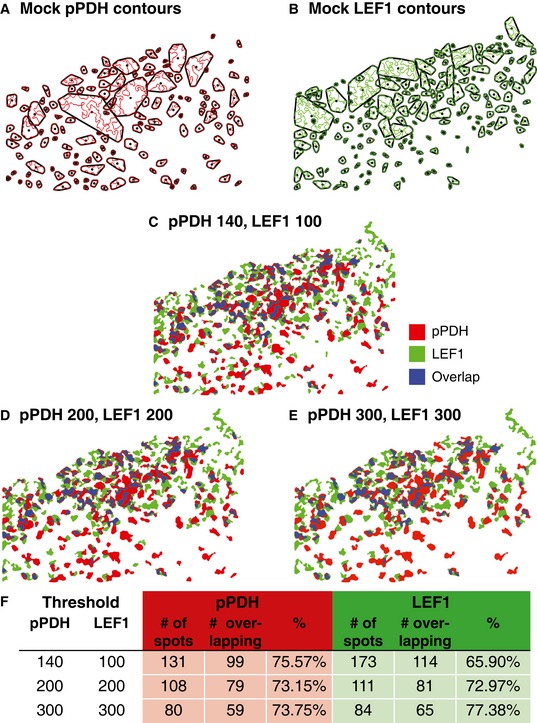
Convex hull image analysis of serial sections of SW480 mock xenograft tumors stained for pPDH and LEF1, as shown in Fig 1A and B, second panels.
-
A, BIsolated contour maps with convex hull outlines for pPDH and LEF1.
-
C–EpPDH and LEF1 contour maps were overlaid on each other and overlapped regions highlighted in blue. Different thresholds for spot detection were tested; each threshold condition revealed between 65 and 77% overlap between pPDH and LEF1 spots.
-
FSummary of overlap results.