
Figure EV2. Wnt ligand and glycolysis gene expression in rectal cancer patients post‐radiochemotherapy.
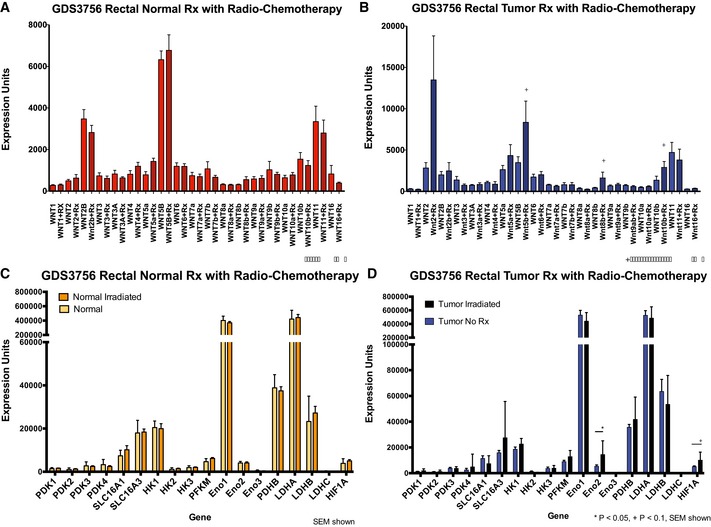
Gene expression data, from GEO dataset GDS3756, of 21 rectal cancer patients before and after radio‐chemotherapy (Snipstad et al, 2010).
-
A, BExpression of Wnt ligands WNT5B, WNT8B, and WNT10B shows trends toward increased expression in rectal tumor tissue treated with radiochemotherapy, but these changes do not reach statistical significance when P < 0.05 is used as a cutoff (specific P‐values are 0.10, 0.10, and 0.08, respectively). Statistical significance was determined using the Mann–Whitney U‐test with Benjamini–Hochberg correction for multiple hypothesis testing.
-
C, DExpression of the glycolytic enzyme ENO2 is specifically increased in tumor tissue after radiochemotherapy (P = 0.008); HIF1A expression also shows a trend in increased expression (P = 0.06). * denotes adjusted P‐value < 0.05; + denotes adjusted P‐value < 0.10. Statistical significance was determined using the Mann–Whitney U‐test with Benjamini–Hochberg correction for multiple hypothesis testing.