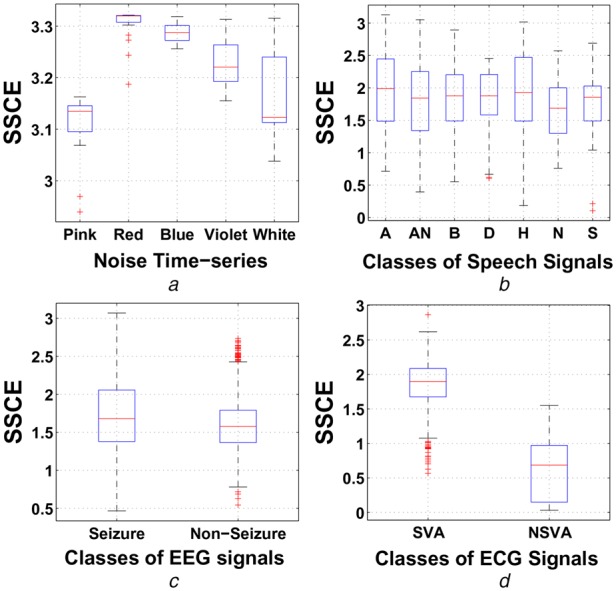
Fig. 1.

Within-class variations (boxplot) of SSCE measure for synthetic, EEG, ECG and speech signals of different classes
a Within-class variations of SSCE for different noise time series
b Within-class variations of SSCE for different emotion class in speech signals (A-Anger, AN-Anxiety, B-Boredom, D-Disgust, H- Happiness, N-Neutral and S-Sadness)
c Within-class variations of SSCE for seizure and non-seizure classes using EEG signals
d Within-class variations of SSCE for shockable ventricular arrhythmia (SVA) and non-shockable ventricular arrhythmia (NSVA) classes using ECG signals
