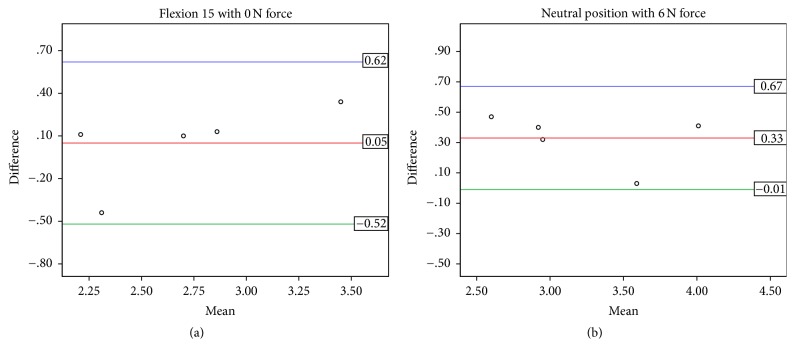
Figure 5.
Distribution plots from Bland-Altman analyses for between-days repeatability (N = 5) of mean peak blood flow velocity (cm/s) in (a) 15° flexion without force and (b) neutral wrist with 6 N force. The x-axis represents the between-days mean measurement. The y-axis represents the between-days difference between measurements. The mean line represents the mean difference between days with the upper and lower lines representing the limits of agreement (1.96 SD).

