
Figure 3.
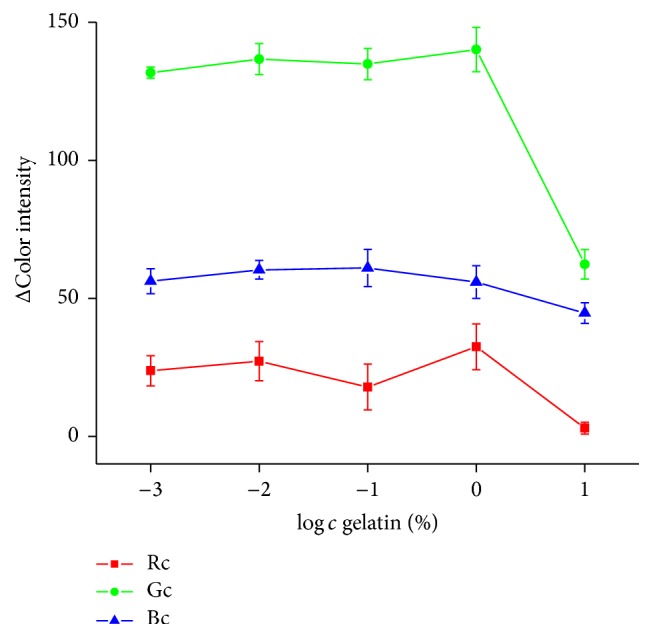
Gelatin optimization. Drop in ΔColor intensity indicates that pH strip did not change into red color. Error bars represent standard error of the mean for n = 3. Rc = red channel, Gc = green channel, and Bc = blue channel.
Official websites use .gov
A
.gov website belongs to an official
government organization in the United States.
Secure .gov websites use HTTPS
A lock (
) or https:// means you've safely
connected to the .gov website. Share sensitive
information only on official, secure websites.
Gelatin optimization. Drop in ΔColor intensity indicates that pH strip did not change into red color. Error bars represent standard error of the mean for n = 3. Rc = red channel, Gc = green channel, and Bc = blue channel.