Figure 2.

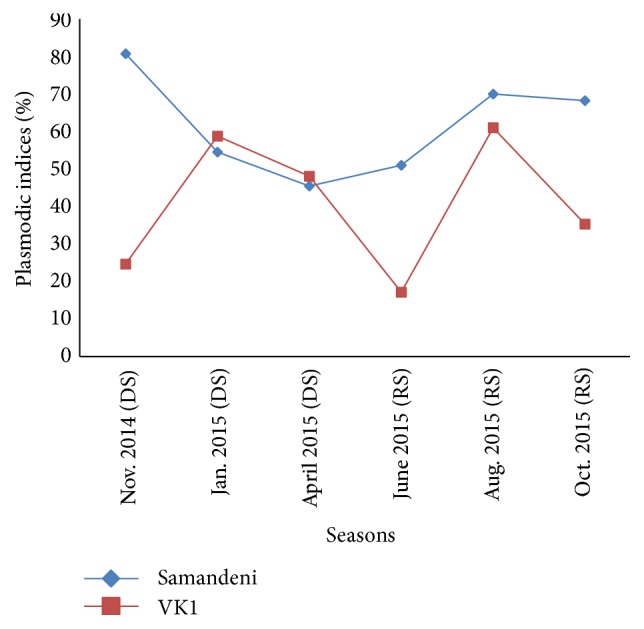
Seasonal variation of plasmodic indices of study sites. DS: dry season; RS: rainy season; the blue curve: seasonal variation of Samandeni children's plasmodic index; the red curve: seasonal variation of the VK1 children's plasmodic index.

Seasonal variation of plasmodic indices of study sites. DS: dry season; RS: rainy season; the blue curve: seasonal variation of Samandeni children's plasmodic index; the red curve: seasonal variation of the VK1 children's plasmodic index.