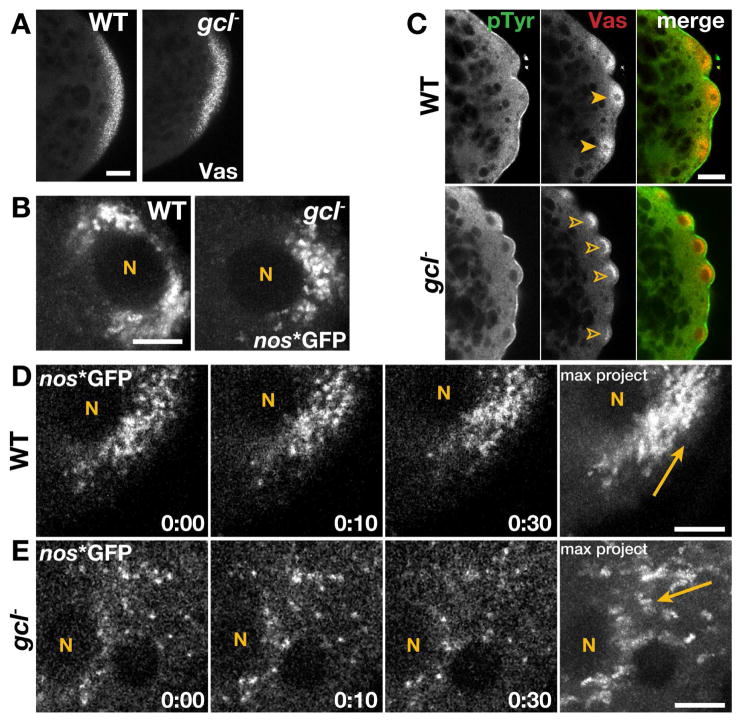
Figure 1. Germ plasm distribution is aberrant in gcl embryos.
In all images, posterior is to the right. (A) Immunofluorescence for Vas in 0–1 hr WT and gcl embryos. (B) Maximum intensity projections show 8.3s of elapsed time from live 1–2 hr embryos expressing nos*GFP. (C) 1–2 hr embryos stained for the indicated proteins; closed arrowheads, symmetric Vas; open arrowheads, uneven/reduced Vas. (D and E) Time-lapse imaging of nos*GFP in live 1–2 hr embryos. Time is shown min:s; “N”, PB nuclei; arrows mark trajectory of nos*GFP. Bars: (A and C) 20 μm; (B, D, and E) 5 μm.

