Figure 2.
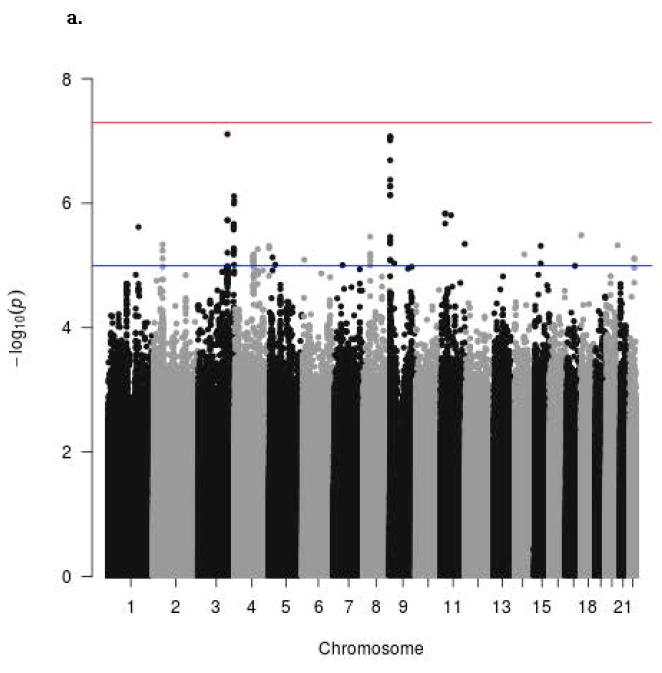
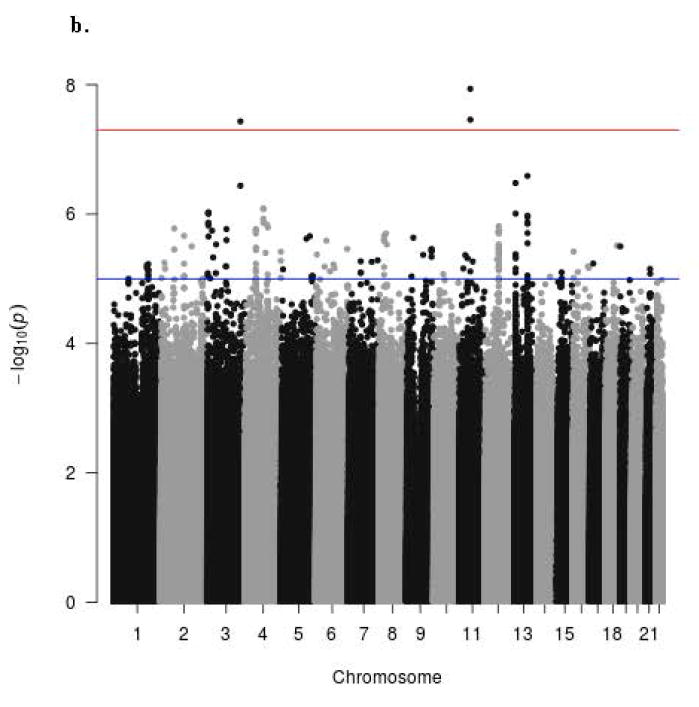
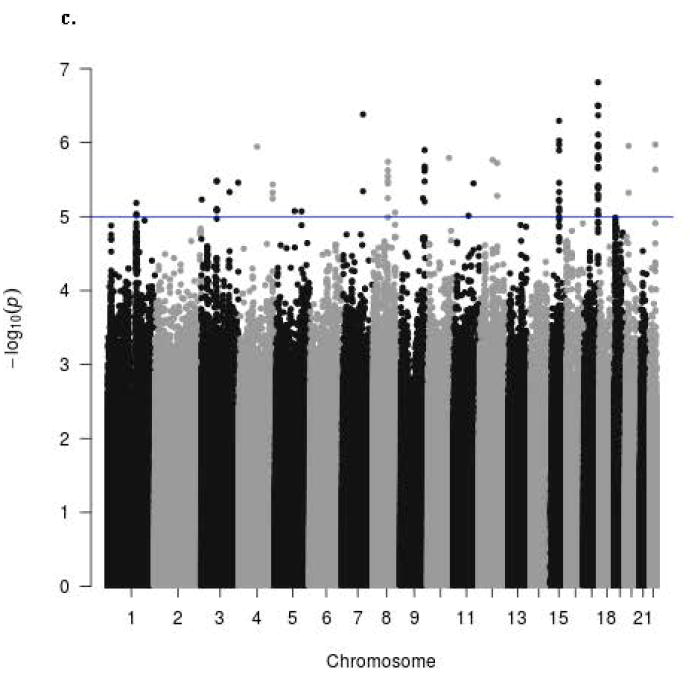
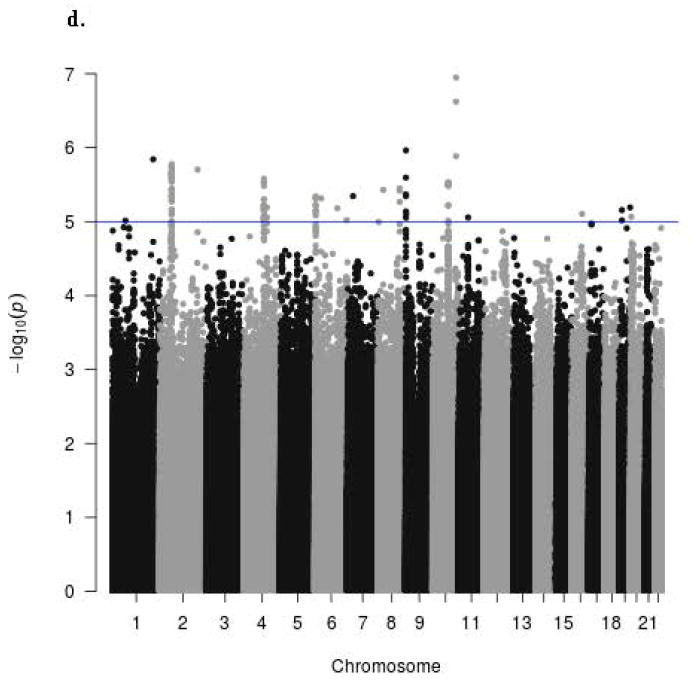
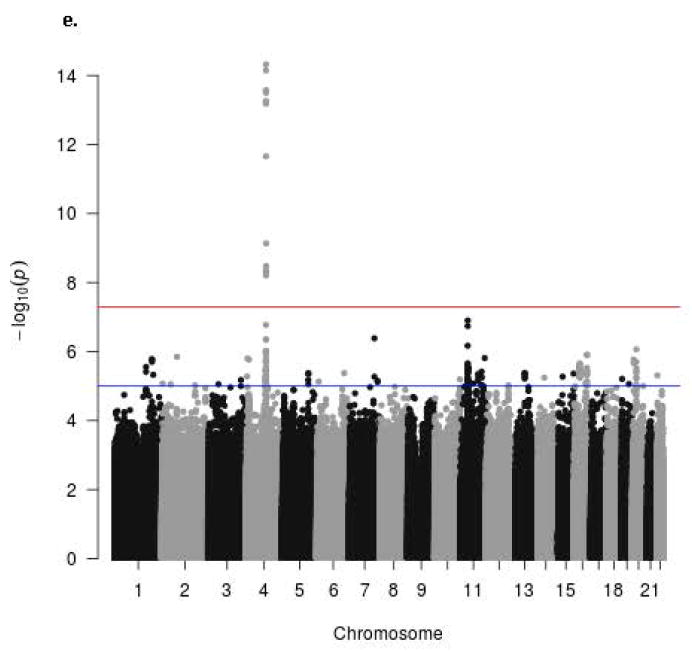
Manhattan signal plot of meta-analysis of associations of all genotyped single-nucleotide polymorphisms (SNPs) with vasomotor symptoms. Blue line denotes p-value below 5 X 10⁻⁵; red line denotes p-value below 5 X 10⁻⁸.
a. Manhattan plot for participants of GARNET Study
b. Manhattan plot for participants of SHARE-AA Study
c. Manhattan plot for participants of SHARE-HA Study
d. Manhattan plot for participants of WHIMS+ Study
e. Manhattan plot of meta-analysis showing statistical significance of all genotyped single-nucleotide polymorphisms (SNPs)
