
Figure 1. Sporulation in Gram-positive and Gram-negative bacteria.
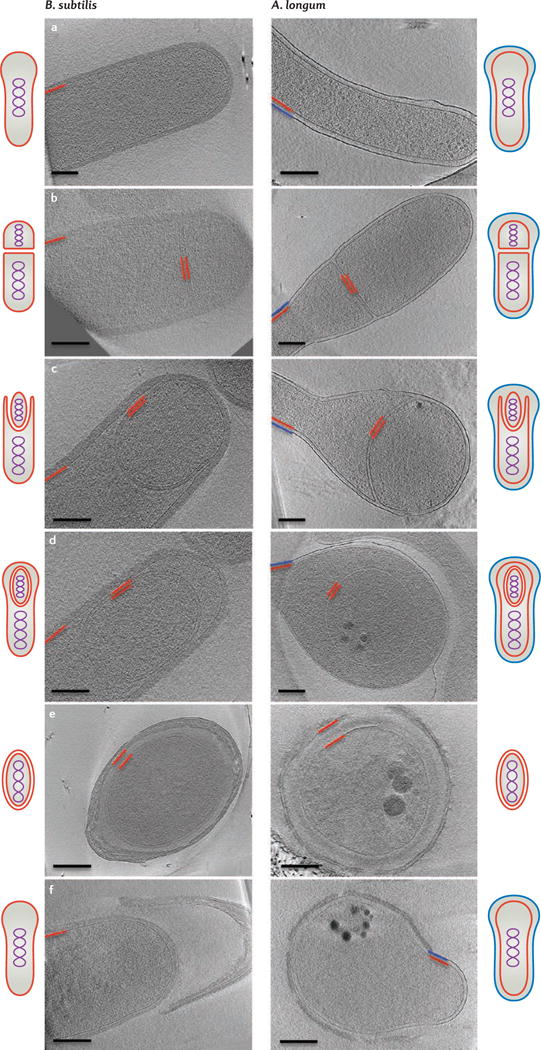
Overview of bacterial sporulation in Bacillus subtilis (left) and Acetonema longum (right) by electron cryotomography (ECT). Each panel represents a tomographic slice through a bacterial cell at a different stage of sporulation. Part a shows vegetative cells, part b shows the formation of the septum, part c shows engulfment, part d shows forespores, part e shows mature spores and part f shows germinating cells. The inner membrane and cytoplasmic membrane are depicted in red and the outer membrane of A. longum is depicted in blue. Schematic representations of all sporulation stages are shown next to the tomographic slices. Scale bar 200 nm. Images in the left panels of parts d–f are adapted with permission from REF. 21, Wiley. Images in the right panels of parts a, b, d, e and f are adapted with permission from REF.10, Elsevier.