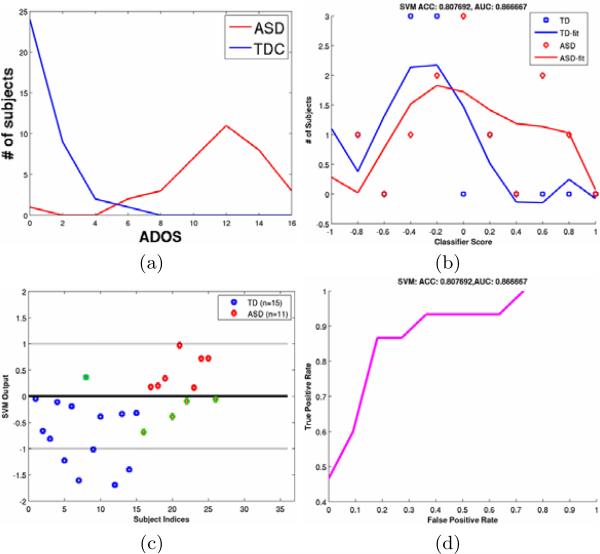
Fig. 7.
(a) Distribution of subjects according to ADOS. (b) Distribution of subjects according to SVM output. In an ideal situation it should be as similar to (a) as possible. (c) SVM output for different subjects. The misclassified ones are encircled in green. (d) The ROC curve for the leave-one-out cross-validation.

