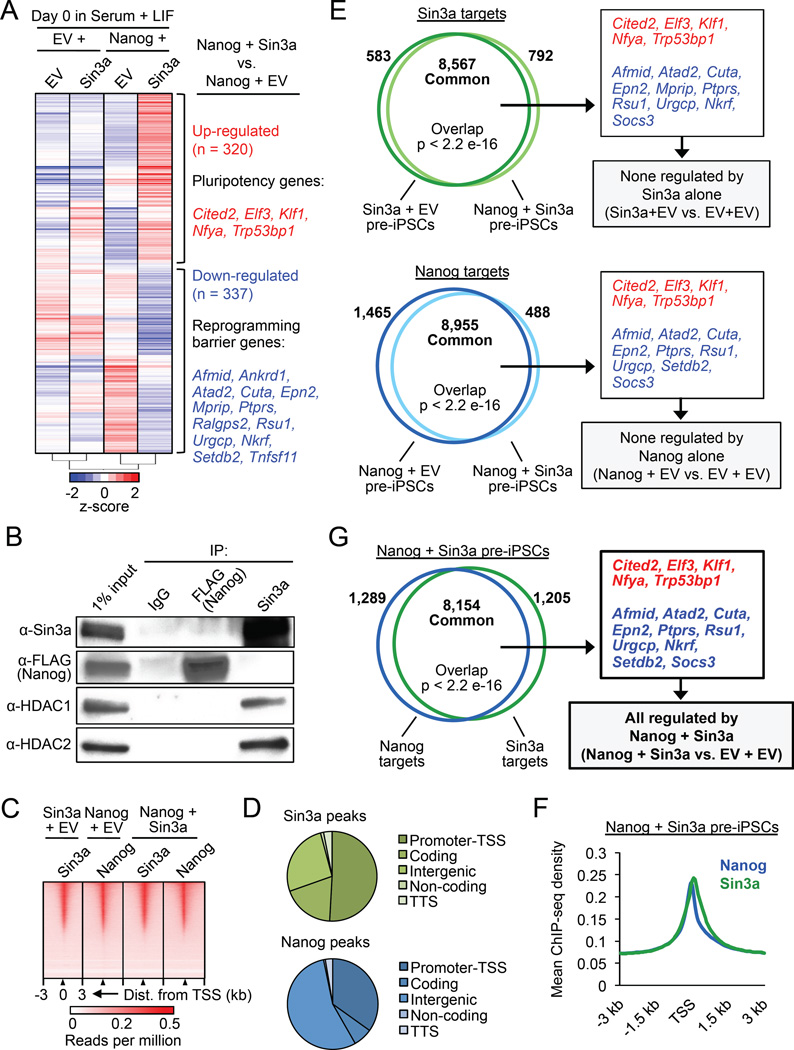
Figure 4. Nanog and Sin3a directly activate pluripotency genes and repress reprogramming barrier genes in pre-iPSCs. See also Figure S4.
(A) Microarray heat maps of significantly differentially expressed genes (p < 0.05, fold change ≥ 1.5) in NSC pre-iPSCs. Genes in red and blue are up- and down-regulated, respectively, in Nanog + Sin3a pre-iPSCs relative to Nanog + EV pre-iPSCs (right).
(B) IP/co-IP for 3×FLAGNanog, Sin3a, HDAC1, and HDAC2 in Nanog + Sin3a NSC pre-iPSCs.
(C) Heat maps for genome-wide binding of Nanog and/or Sin3a in indicated pre-iPSC populations.
(D) Genome-wide distribution of Nanog and Sin3a peaks in Nanog + Sin3a pre-iPSCs. Promoter-TSS = −1 kb to +100 bp from transcription start site (TSS), coding = exons, TTS = −100 bp to +1 kb from transcription termination site (TTS).
(E) Venn diagrams showing significantly overlapping Sin3a targets (top) and Nanog targets (bottom) in indicated pre-iPSC populations, as well as microarray genes of interest contained within common target sets (right).
(F) Average ChIP-seq read density for Nanog and Sin3a in Nanog + Sin3a pre-iPSCs.
(G) Venn diagram showing significant overlap of Nanog and Sin3a targets in Nanog + Sin3a pre-iPSCs (left), as well as microarray genes that are directly regulated by Nanog + Sin3a (right).

